Technical analysis by RB_T about Symbol ETH: Buy recommendation (12/5/2025)

RB_T
اتریوم بالای 3000 دلار تثبیت شد: مسیر صعودی تا 7160 دلار آغاز شده است؟
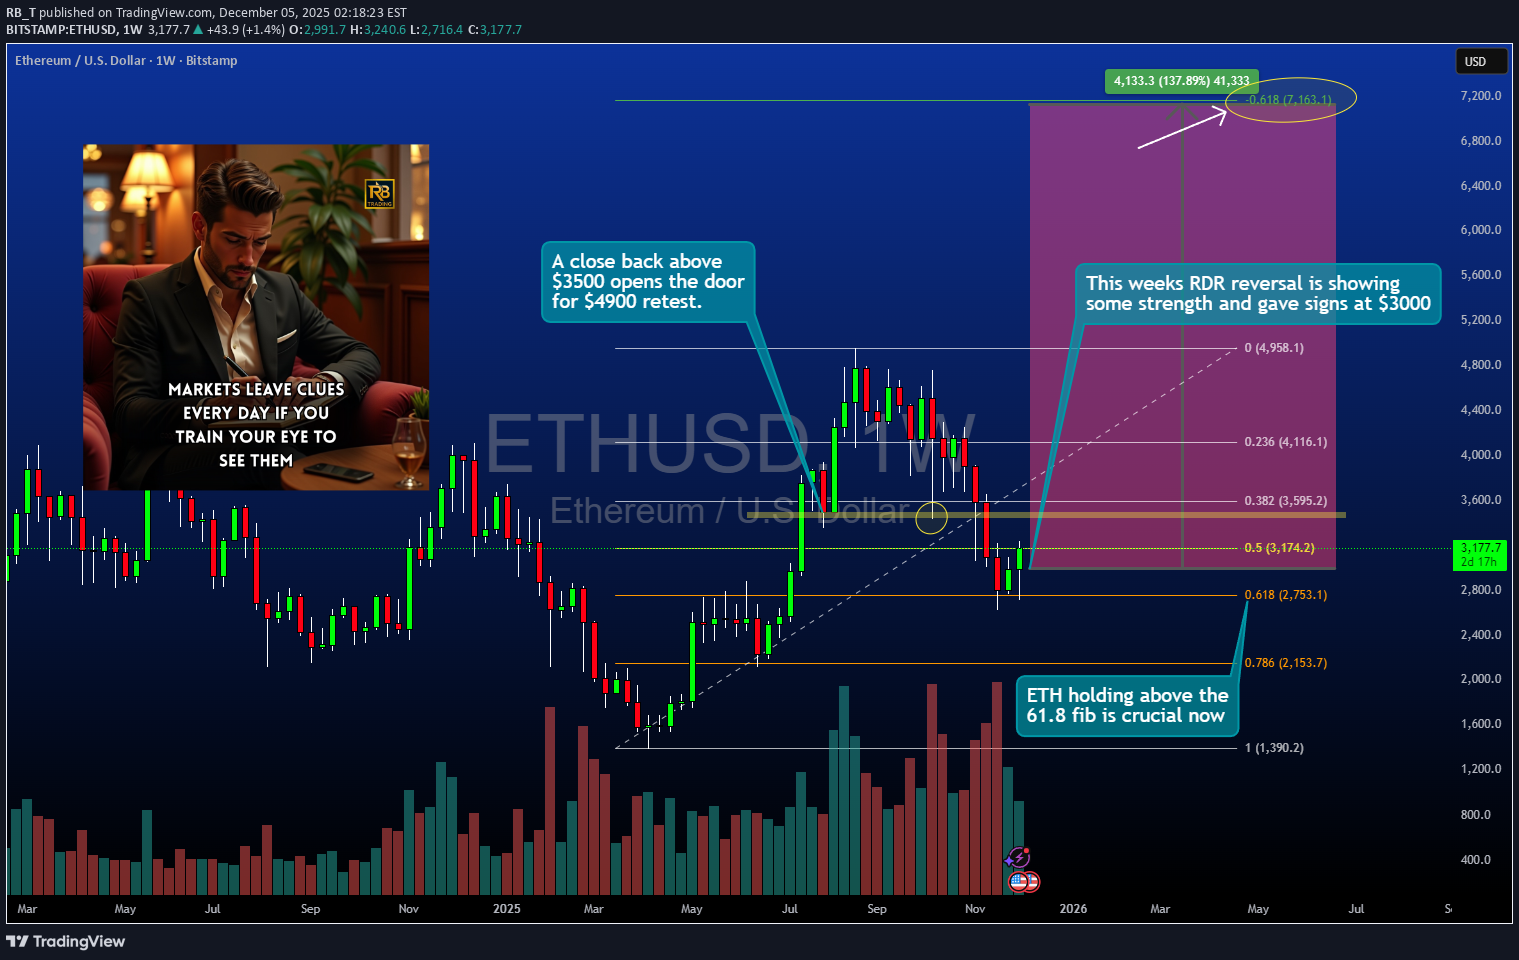
Ethereum Structural Reversal Complete: Weekly Candle Confirms $3000+ Hold, Targeting $4900 with $7160 Extension Ethereum has completed a significant structural reversal with weekly candle confirmation above the critical $3000 psychological level. The 0.618 Fibonacci retracement has held on the weekly timeframe, creating a multi-month setup targeting previous highs at $4900, with extended targets reaching the 1.618 Fibonacci extension at $7160. 🎯 Setup Overview: Current Status: Weekly bullish reversal confirmed above $3000 Critical Level: $3500 close needed to confirm continuation Intermediate Target: $4900 (previous cycle highs) Extended Target: $7160 (1.618 Fibonacci extension) Position Type: Spot portfolio addition for long-term hold 📊 What Just Happened: The Weekly Flip: Ethereum's weekly candle closed decisively above $3000, marking the first sustained hold above this psychological level after months of consolidation and testing. This isn't a wick or a brief spike it's a confirmed close on the weekly timeframe, which carries significantly more weight than intraday or daily moves. The 0.618 Support: The 0.618 Fibonacci retracement level (calculated from cycle lows to previous highs) has held throughout the recent consolidation period. This golden ratio level marks where deep corrections in bull markets typically find support before resuming uptrends. Momentum Shift: Weekly momentum indicators have flipped from bearish to bullish. The reversal isn't just price it's confirmed by: Volume expansion on the breakout Momentum oscillators crossing into bullish territory Market structure shifting to higher lows 📈 Why $3500 Is The Key Level: The Gate to Higher Prices: A weekly close above $3500 would accomplish several technical objectives: Break above intermediate resistance that capped prior rallies Confirm the $3000 level as support rather than temporary bounce Open clear path to retest previous highs at $4900 Signal institutional accumulation phase is complete Historical Context: $3500 previously acted as both support (before the decline) and resistance (during recovery attempts). A clean break and hold above this level represents role reversal—former support becomes resistance becomes support again. Why Weekly Matters: Daily closes can be manipulated or result from short-term volatility. Weekly closes represent sustained conviction from market participants and institutional positioning that persists across multiple trading sessions. 🎯 The Target Structure: Phase 1: $4900 (Previous Highs) Represents the prior cycle peak ~62% upside from current $3000 level Major psychological resistance where profit-taking will occur First logical target for position reduction Phase 2: $7160 (1.618 Fibonacci Extension) Long-term extension target based on geometric progression Represents 138% upside from $3000 Aligns with potential new cycle highs Final target for remaining position Why These Targets: Not arbitrary price predictions geometric extensions based on: Historical price structure Fibonacci ratios that have guided ETH throughout its history Measured moves from confirmed support levels Previous cycle behavior patterns 📊 Technical Confluence: Weekly 0.618 Fibonacci: This deep retracement level held as support, indicating strong hands accumulated the pullback. When 0.618 holds, the probability of continuation to previous highs increases significantly based on historical crypto cycles. $3000 Psychological Level: Round numbers matter in crypto. $3000 represents a major psychological threshold that attracts both retail and institutional attention. Holding above this level shifts sentiment. Volume Confirmation: The move above $3000 occurred with increasing volume, suggesting accumulation from larger players rather than retail FOMO. Sustainable moves require volume validation. Market Structure: Higher lows are now establishing on the weekly chart. This is textbook uptrend structure after a corrective phase completes. 🛡️ Spot Portfolio Addition Strategy: Why "Spot" Matters: This isn't a leveraged trade or short-term speculation. This is spot accumulation for a multi-month to multi-year position. Key differences: No liquidation risk Can weather volatility without forced exits Designed to capture structural moves, not daily swings Appropriate for long-term asymmetric bet on crypto adoption Position Sizing: Crypto allocation should be sized according to: Personal risk tolerance (typically 5-10% of portfolio max) Ability to withstand 30-50% drawdowns without panic Long-term conviction in Ethereum's utility and adoption Understanding this is a high-risk, high-reward allocation Entry Approach: Primary entry: Current $3000+ zone (confirmed support) Additional entry: Pullback to $3200-3300 if opportunity presents Final add: On confirmed break above $3500 (momentum confirmation) This staged approach improves average entry while maintaining conviction. 📈 Why Ethereum for Long-Term Hold: Fundamental Backdrop: Ethereum 2.0 transition to proof-of-stake complete Growing DeFi ecosystem with real utility NFT and tokenization infrastructure Institutional adoption increasing (ETFs, corporate treasury) Deflationary tokenomics post-EIP-1559 Market Position: ETH represents the second-largest cryptocurrency by market cap with established network effects, developer activity, and institutional recognition. Risk Acknowledgment: Crypto remains highly speculative and volatile. Regulatory uncertainty, technological risks, and market sentiment shifts can cause dramatic price swings unrelated to technical structure. 🧠 Why Most Will Miss This Setup: Fear from Past Pain: Many traders were hurt during the drawdown from previous highs. That emotional scar makes re-entry uncomfortable precisely when risk/reward is most favorable. Waiting for "Confirmation": By the time $4000 or $4500 "confirms" the move, the best risk/reward is gone. Entry at $3000 with $2700 stop offers far superior asymmetry than entry at $4000 with $3500 stop. Disbelief After Consolidation: Long consolidation periods create disinterest. When breakouts finally occur, many aren't watching anymore yet these are often the highest-probability setups. Recency Bias: Recent sideways action makes traders assume more sideways action. Weekly timeframe reversal suggests the character of price action is changing. 📊 Fibonacci Extensions Explained: Why They Guide Long-Term Moves: Fibonacci extensions (1.272, 1.618, 2.618) project where impulse waves typically complete based on the size of previous moves. The $7160 target (1.618 extension) isn't random—it's a mathematical projection. Historical Validation: Throughout crypto history, major bull moves have repeatedly respected these extension levels. Bitcoin, Ethereum, and other major assets have demonstrated this pattern across multiple cycles. How to Use Them: Identify completed corrective structure (0.618 support held) Measure from correction low to breakout high Project extensions for potential targets Use these as profit-taking zones, not guaranteed destinations 📅 Timeframe Expectations: Multi-Month Position: From $3000 to $4900 could take 3-6 months depending on momentum and broader crypto market conditions. This isn't a swing trade—it's a position trade. From $4900 to $7160: If achieved, this extension could take 6-12+ months and likely requires favorable macroeconomic conditions and continued crypto adoption narratives. Volatility Acceptance: Expect 15-25% pullbacks even within a bull move. Spot positions can weather this; leveraged positions cannot. This is why spot allocation matters. ⚠️ Risk Factors: Crypto Volatility: 30-50% drawdowns are normal in crypto, even during bull markets. Position sizing must accommodate this reality without forcing emotional exits. Regulatory Uncertainty: Government actions on crypto regulation, particularly in major markets like the US and EU, can cause rapid sentiment shifts. Macro Environment: Crypto correlates with risk assets. Fed policy, recession fears, and liquidity conditions affect crypto prices significantly. Technical Failure: If Ethereum closes back below $2700 on a weekly basis, the 0.618 support thesis breaks and the bullish structure is compromised. This requires disciplined reassessment. $3500 Rejection: Price could fail at $3500 and consolidate longer before attempting higher targets. Patience required if this scenario plays out. 🏆 The Long-Term Investor Approach: They Buy Structure, Not Hype: The weekly 0.618 hold + $3000 breakout provides objective structure. No need for hopium just probability-based positioning. They Size Appropriately: 5-10% crypto allocation allows exposure to asymmetric upside while containing downside to manageable levels if thesis fails. They Think in Cycles: Crypto moves in multi-year cycles. Current positioning is for the next expansion phase, not next week's price action. They Scale Out at Targets: Reduce 1/3 at $4900 (books significant profit, removes emotion) Reduce 1/3 at $5800-6000 (locks more gains if extension occurs) Final 1/3 at $7160 or trailing stop (maximizes upside while protecting capital) 📌 Key Takeaways: ✅ Weekly confirmation matters: Daily noise is filtered out; weekly close above $3000 signals structural change. ✅ 0.618 support held: This Fibonacci level has historically marked the end of corrections in crypto bull markets. ✅ $3500 is the gateway: Close above this level opens clear path to retest $4900 highs with minimal resistance. ✅ $7160 represents geometric extension: Not speculation mathematical projection based on Fibonacci ratios that have guided ETH historically. ✅ Spot allocation appropriate: Long timeframe, high volatility, and asymmetric potential make this a spot hold, not a leveraged trade. ⚠️ Important Disclaimers: This analysis is for educational purposes and reflects a technical view based on weekly timeframe structure, Fibonacci analysis, and crypto market cycles. It is not financial advice or a recommendation to buy or sell Ethereum or any cryptocurrency. Cryptocurrencies are highly speculative and volatile. Price can drop 30-50% in days regardless of technical structure. The $7160 target represents a mathematical extension, not a guaranteed destination. Regulatory risk, technological vulnerabilities, and market manipulation are inherent to crypto markets. Past cycle behavior does not guarantee similar patterns will repeat. The 0.618 support could fail. If Ethereum closes below $2700 on a weekly basis, the bullish thesis is compromised and requires immediate reassessment. Only invest capital you can afford to lose completely. Crypto allocation should be sized as high-risk, high-reward portion of diversified portfolio. Consider consulting a financial professional and understand the technology and risks before investing. All cryptocurrency investing involves substantial risk of loss. ✨ Join the Discussion: Are you accumulating Ethereum at these levels? How do you approach spot crypto allocation in your portfolio? Share your perspective in the comments. 📜 Buy structure. Think in cycles. Hold with conviction.