Technical analysis by SpyOnGems about Symbol 1INCH: Buy recommendation (12/2/2025)

تحلیل 1INCH/USDT: مثلث نزولی بلندمدت و دو راهی حیاتی حمایت و مقاومت
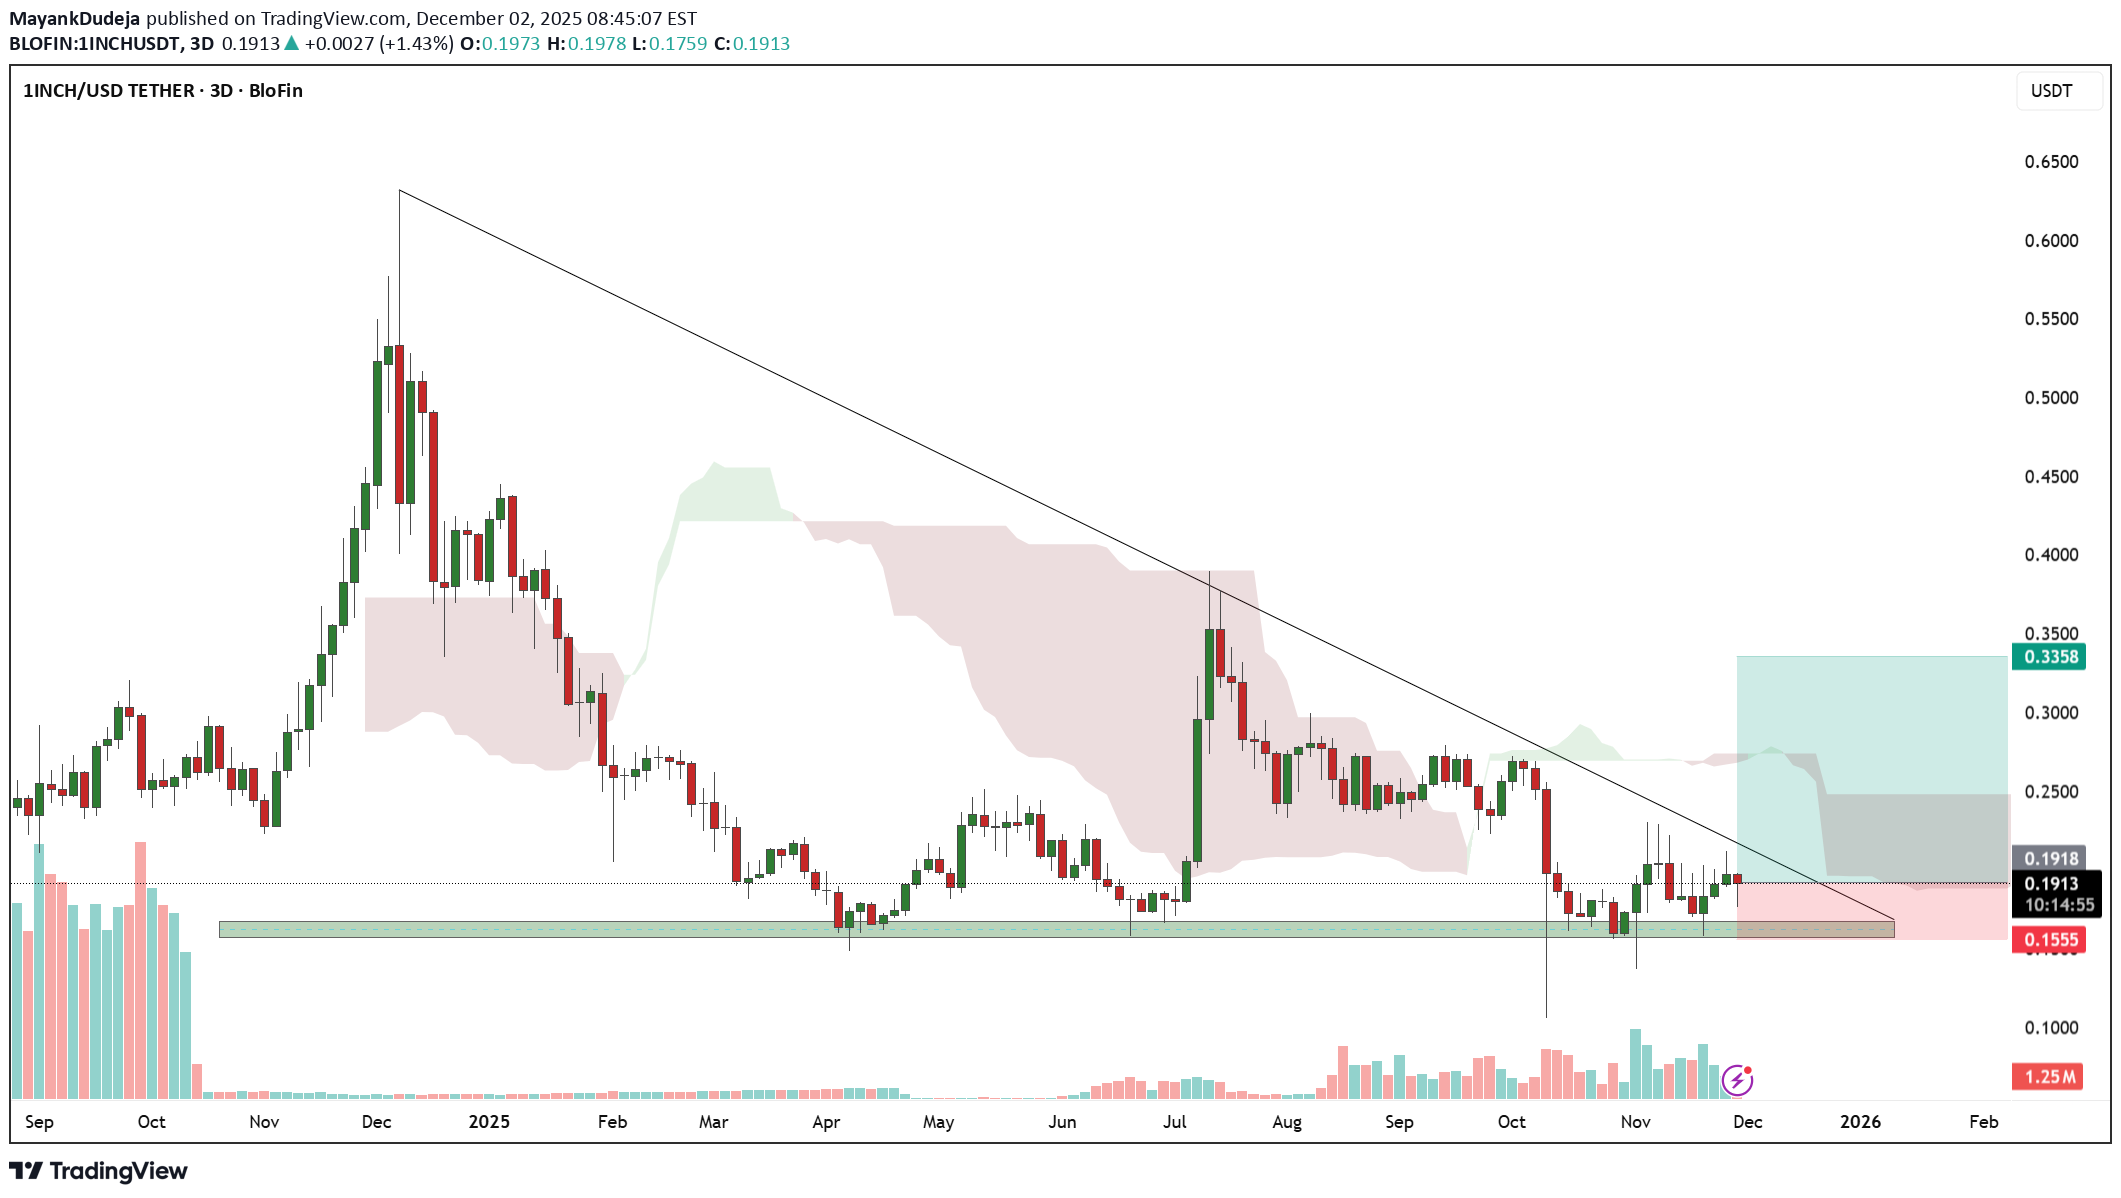
On the 3-day chart of 1INCH/USDT, the price is trading inside a long-term descending triangle pattern, capped by a strong downtrend line from the previous major high near $0.60. The horizontal support zone around $0.16–$0.18 has repeatedly held since early 2025, acting as a major accumulation base. Each dip into this area has been met with buying pressure, shown by long lower wicks and volume spikes, confirming it as a strong demand zone. However, momentum remains weak as the candles are still forming below the Ichimoku cloud, keeping the broader trend bearish. Currently, 1INCH is consolidating near $0.19, facing resistance from the descending trendline and lower edge of the cloud near $0.22–$0.24. A decisive breakout and close above that zone would be the first sign of a potential trend reversal, possibly targeting $0.28–$0.32 in the mid-term. But if the price fails to hold above the $0.16–$0.18 support and breaks down, it could extend lower toward $0.13–$0.14, which is the next major liquidity pocket. Overall, the structure remains bearish-neutral, with accumulation signs at the base but no confirmed reversal until a breakout above the descending trendline.