Technical analysis by MMBTtrader about Symbol XLM: Buy recommendation (11/26/2025)

MMBTtrader
احتمال پامپ ۵۰ درصدی XLM: آیا خط روند تاریخی تکرار میشود؟
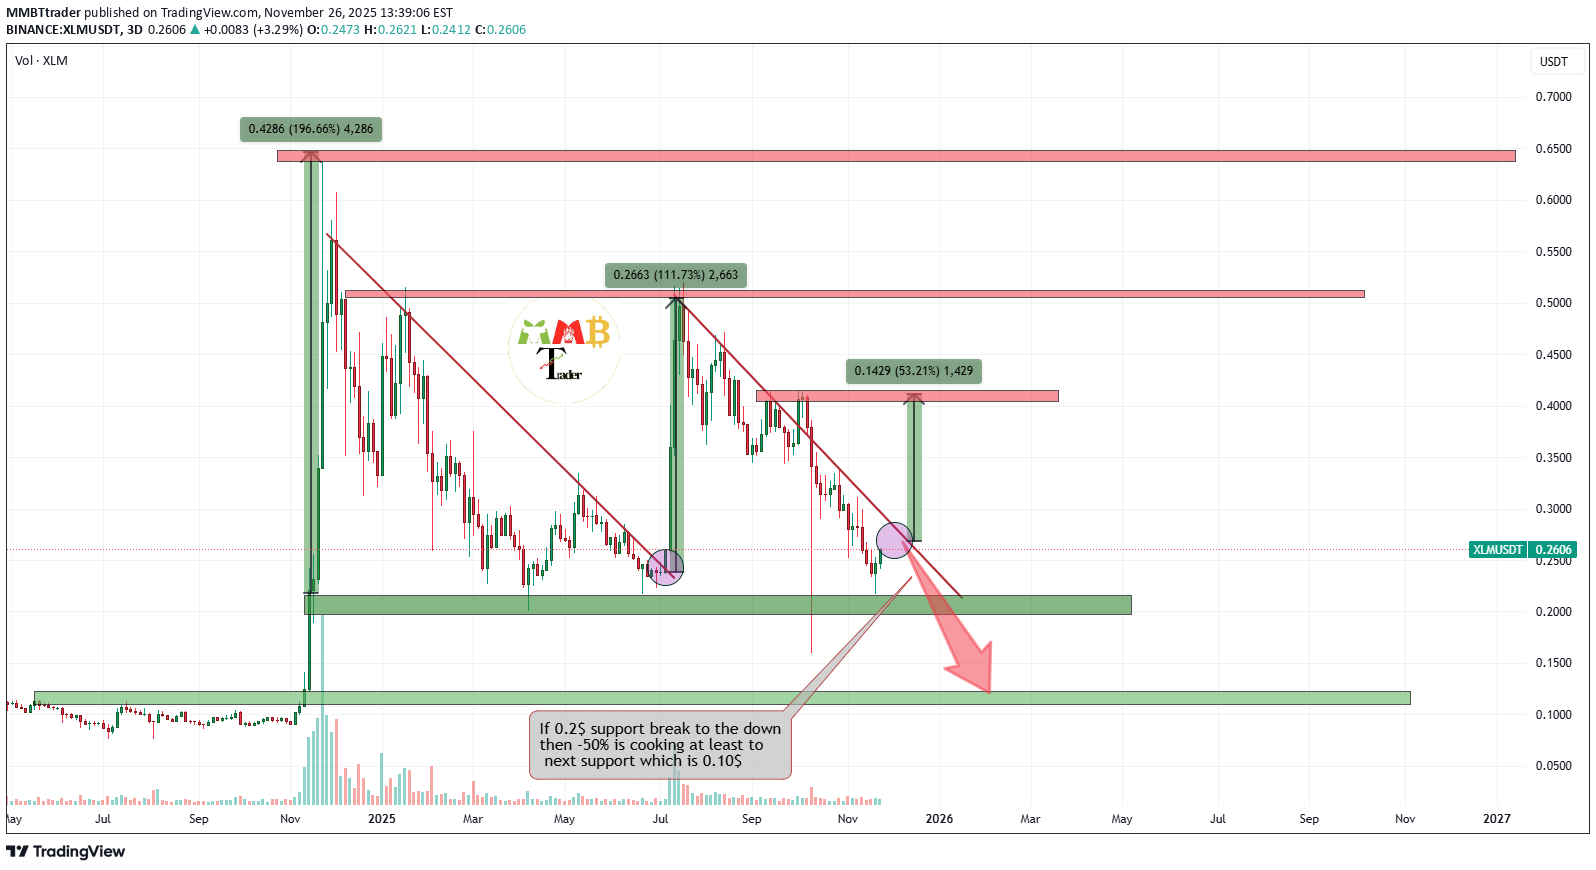
Technical analysis of XLM reveals a compelling pattern analogy. Historically, the asset demonstrated a decisive breakout above a daily trendline resistance, which preceded approximately 100% appreciation. Currently, XLM is consolidating near a newly formed daily trendline within a broader range-bound market structure.
We identify two primary probabilistic scenarios:
Bullish Case (70% Probability):
A successful breakout above the current trendline resistance could catalyze an upward impulse toward the $0.40 resistance level, representing approximately +50% appreciation from current levels.
Bearish Case (30% Probability):
Conversely, a breakdown below the critical $0.20 support level would invalidate the bullish thesis, potentially triggering a downward move toward -50% from current valuation.
The higher probability weighting toward the bullish scenario reflects the historical pattern repetition and current consolidation characteristics, though traders should monitor the $0.20 level as a crucial invalidation point for risk management purposes.
DISCLAIMER: ((trade based on your own decision))
<