Technical analysis by coinpediamarkets about Symbol KAS on 11/26/2025

coinpediamarkets
آیا کاسپا (KAS) سقوط میکند؟ تحلیل مهم روزانه و منطقه فروش حیاتی برای ریزش جدید!
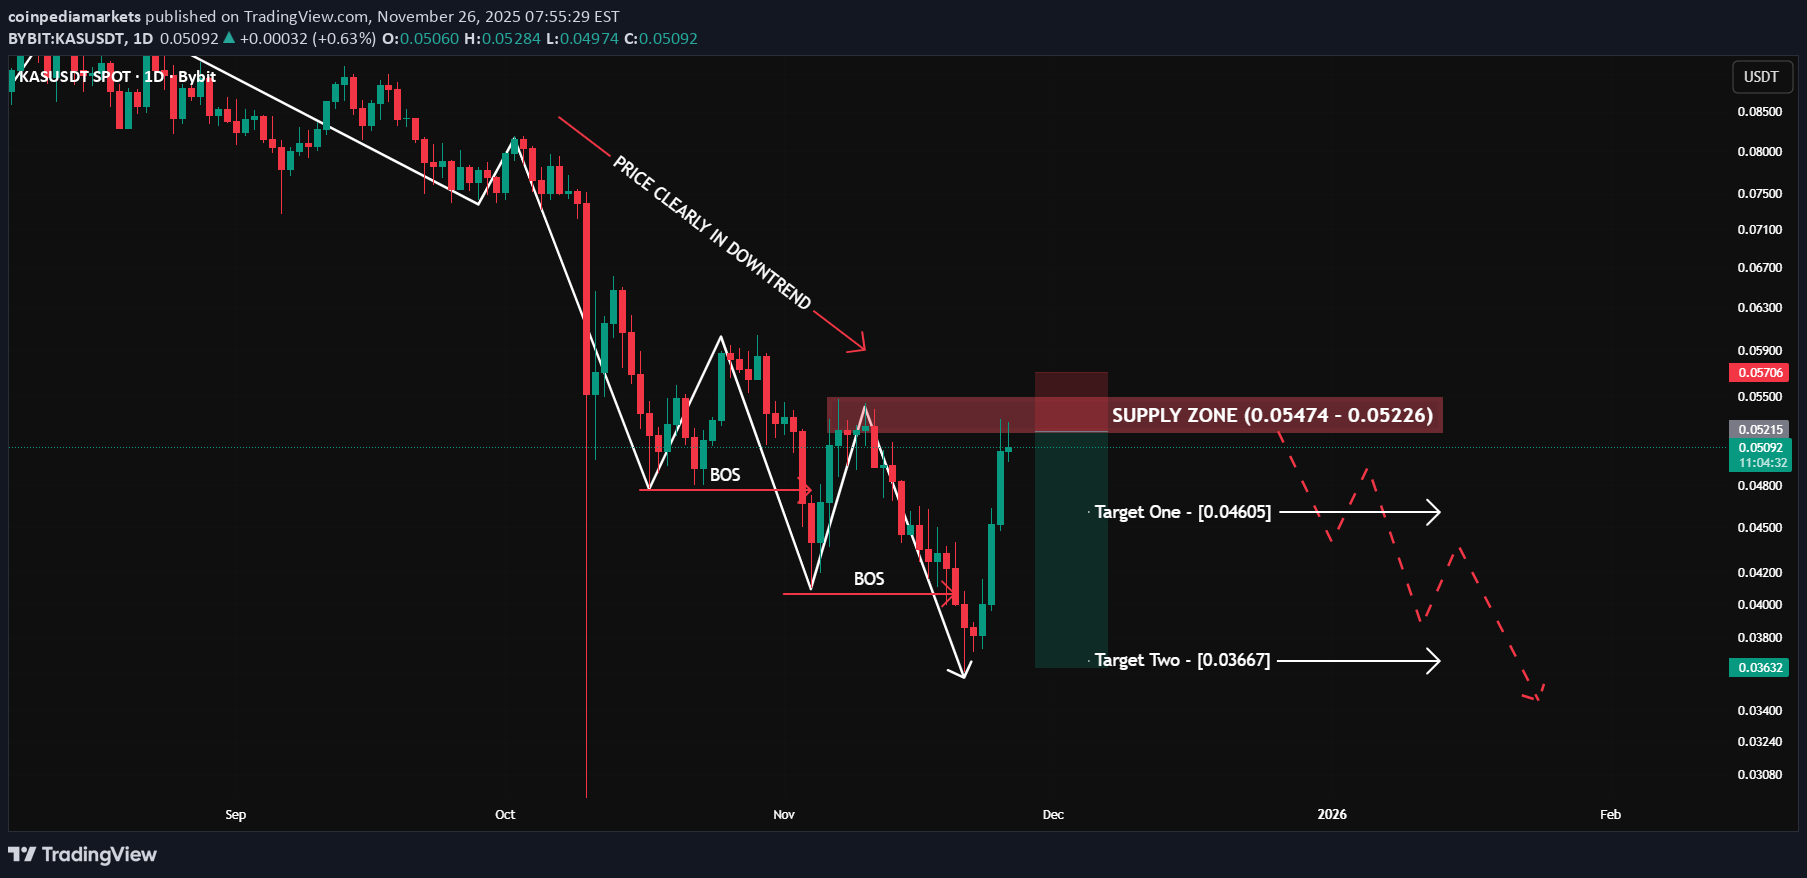
Pattern: Bearish Downtrend Retracement Into Major Supply Zone + Downside Continuation Setup The chart shows Kaspa (KAS) pulling back into a high-probability supply zone after a strong downtrend. Despite a sharp relief rally, market structure remains bearish with repeated Breaks of Structure (BOS). Price is now reacting inside a major supply block, which historically generated aggressive sell-side displacement. Key Observations: 🔹 Strong Downtrend: KAS has been consistently forming lower highs and lower lows, confirming a clean and well-respected bearish trend. 🔹 Multiple BOS Confirming Bearish Structure: Each upward correction has been followed by another BOS to the downside, showing seller dominance throughout the trend. 🔹 Major Supply Zone ($0.05474–$0.05226): Price is currently tapping a well-defined supply zone — the origin of a previous strong sell-off. This area is likely to attract fresh sell orders from smart money. 🔹 Sharp Retracement Rally: The green impulse shows a fast corrective move, but this is typical in downtrends before the next leg down begins. 🔹 Projected Bearish Path: The dotted arrows indicate the expected downside continuation, with price possibly forming lower-high structures before breaking down further. 🔹 Target Levels Identified: Two clear downside targets are marked based on previous reaction points and liquidity sweeps. Potential Move: If KAS rejects from the supply zone ($0.05474–$0.05226): 🎯 Target One: $0.04605 (The first liquidity pocket and prior reaction zone) 🎯 Target Two: $0.03667 (The deeper continuation level aligning with the overall trend projection) A daily close above $0.05480 would weaken the bearish continuation thesis and signal that buyers may be attempting a structural shift. Summary: Kaspa is firmly trending downward, and the recent pump into the daily supply zone provides an ideal rejection area for continuation. Market structure, BOS levels, and historical sell-off zones all support the bearish narrative. If sellers defend this supply area, KAS could resume the downtrend toward $0.046 and potentially $0.036. Only a strong breakout above the supply zone would invalidate this bearish setup and hint at a possible reversal.Setup has failed guys..