Technical analysis by davidjulien369 about Symbol TON: Buy recommendation (11/25/2025)

davidjulien369
تحلیل کامل معامله خرید TONUSDT: استراتژی ICT و ساختار بازار برای سود ۲.۱۵٪
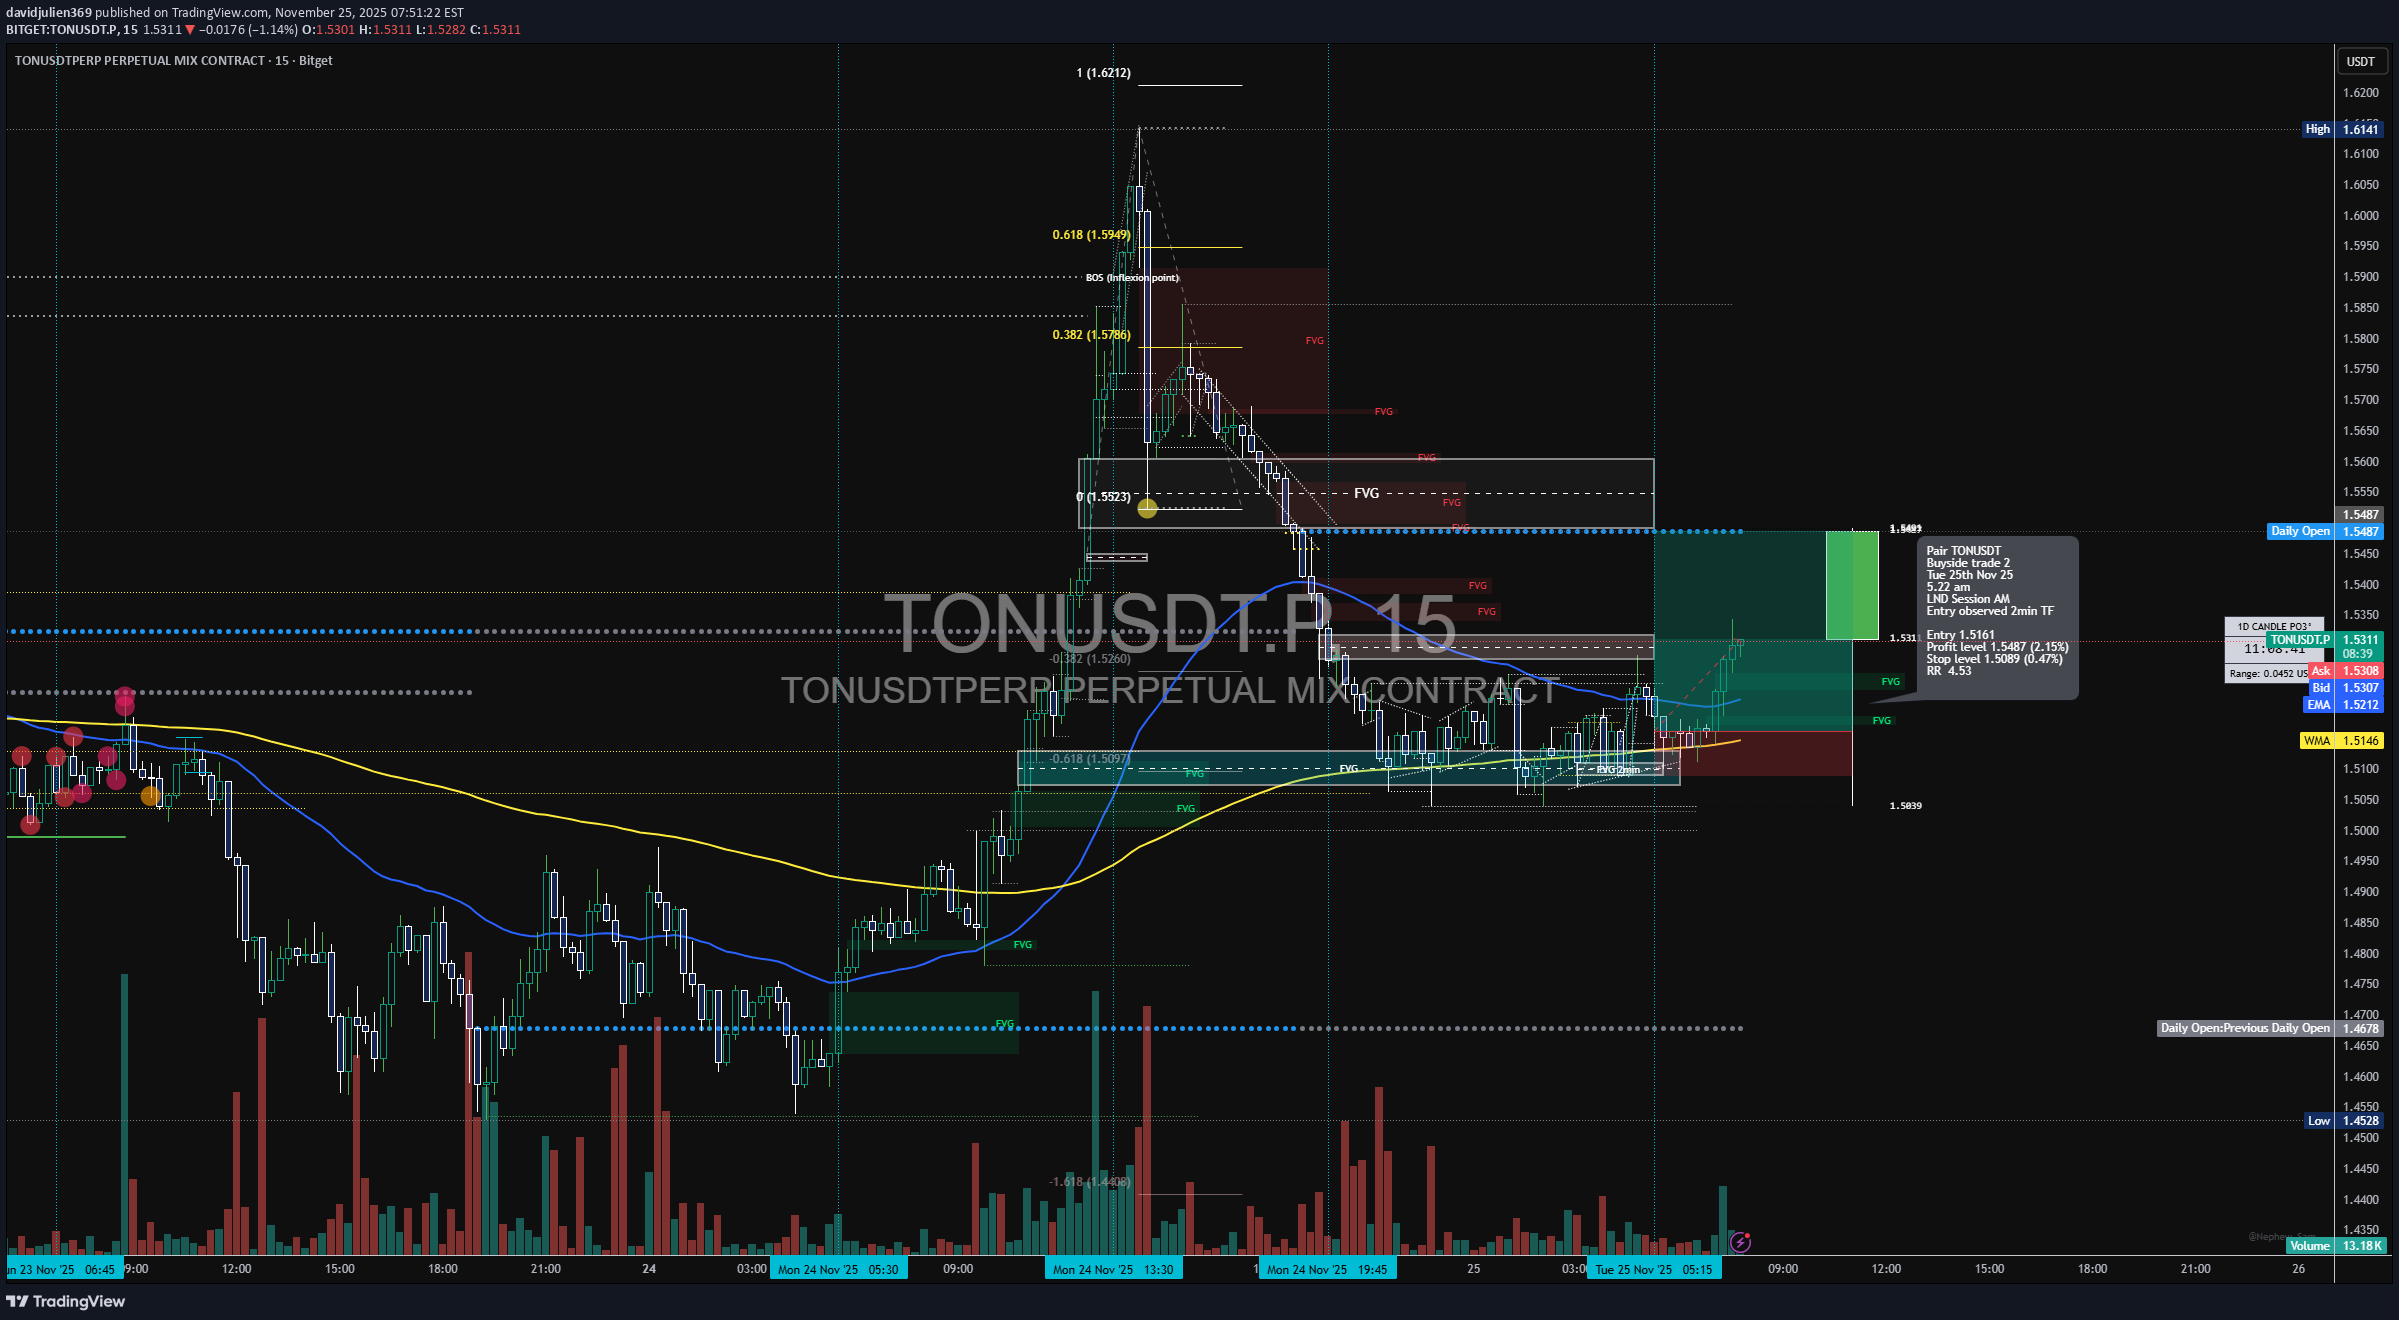
📘 TONUSDT – Trade Journal Entry (2-Min Chart) Tue 25th Nov 25 — 12:30 pm — London Session AM Buyside Trade 🟦 TRADE SUMMARY Pair: TONUSDT Direction: Buyside Date: Tue 25 Nov 25 Time: 12:30 pm Session: LND Session AM Timeframe: 2m 🟩 TRADE PARAMETERS Entry: 1.5161 Take Profit: 1.5487 (+2.15%) Stop Loss: 1.5089 (–0.47%) Risk-to-Reward: 4.53 R 🟨 MARKET CONTEXT & STRUCTURE (Tab 3 — Yellow Transparent) 1. Higher-Timeframe Context TONUSDT completed a macro retracement after a major rally to: 0.382 retracement @ 1.5530 0.618 retracement @ 1.5949 (pivot correction) After the macro correction, price moved into accumulation inside a tight range along the 1.50–1.52 region. 2. Intraday Structure The London AM session shows: A sweep of internal sell-side liquidity at 1.5089 A BOS through 1.5205 A return to a discount FVG A clean Order Block interaction at your entry zone The structure turned decisively bullish, setting up continuation. 15min TF 🟪 LIQUIDITY Sell-Side Liquidity Taken Multiple low hunts at: 1.5097 1.5089 These acted as inducements prior to bullish displacement. Buyside Liquidity Targets Internal buyside pockets: 1.5348 1.5487 HTF buyside targets beyond TP: 1.5600 1.5740 (FVG unmitigated) 1.5949 (macro 0.618 retrace) 🟧 ICT MODEL BREAKDOWN Model Used: SLL Sweep → BOS → FVG → OB Retest → Expansion 1. Inducement Price swept the range low at 1.5089, completing the liquidity cycle. 2. Displacement BOS occurred as price broke above 1.5205 with strong bullish displacement. 3. Entry Confluence Entry at 1.5161 aligns with: ✔ Discount-side FVG ✔ Micro OB retest ✔ Unbalanced price inefficiency ✔ EMA supports (50 EMA crossing above 13 EMA on 2-min) ✔ Strong volume at displacement candle 🟫 WYCKOFF ALIGNMENT Wyckoff PhaseTONUSDT Price Behaviour Phase APreliminary Support at 1.5100 Phase BMulti-hour accumulation zone Phase CSpring at 1.5089 Phase DSOS → LPS (entry) Phase EMark-up to 1.5487 We assume we are in Phase D 🟩 VOLUME & CONFIRMATION Heavy sell volume absorbed at the lows (confirming spring) Volume increased during BOS candle → institutional footprint Declining retracement volume → bullish absorption Strong breakout volume into premium → validates continuation 🟥 OUTLOOK / CONTINUATION As long as price holds above 1.5160–1.5180 (post-break structure): → Expect continuation flow toward premium levels. Upside Continuation Levels 1.5540 (2m FVG) 1.5600 1.5740 (HTF breaker) 1.5949 (macro pivot) Invalidation Break below 1.5089 negates bullish model.