Technical analysis by isahebdadi about Symbol ETH: Buy recommendation (11/21/2025)

اتریوم در آستانه انفجار: سناریوهای صعودی و نزولی تا ۶۰۰۰ دلار!
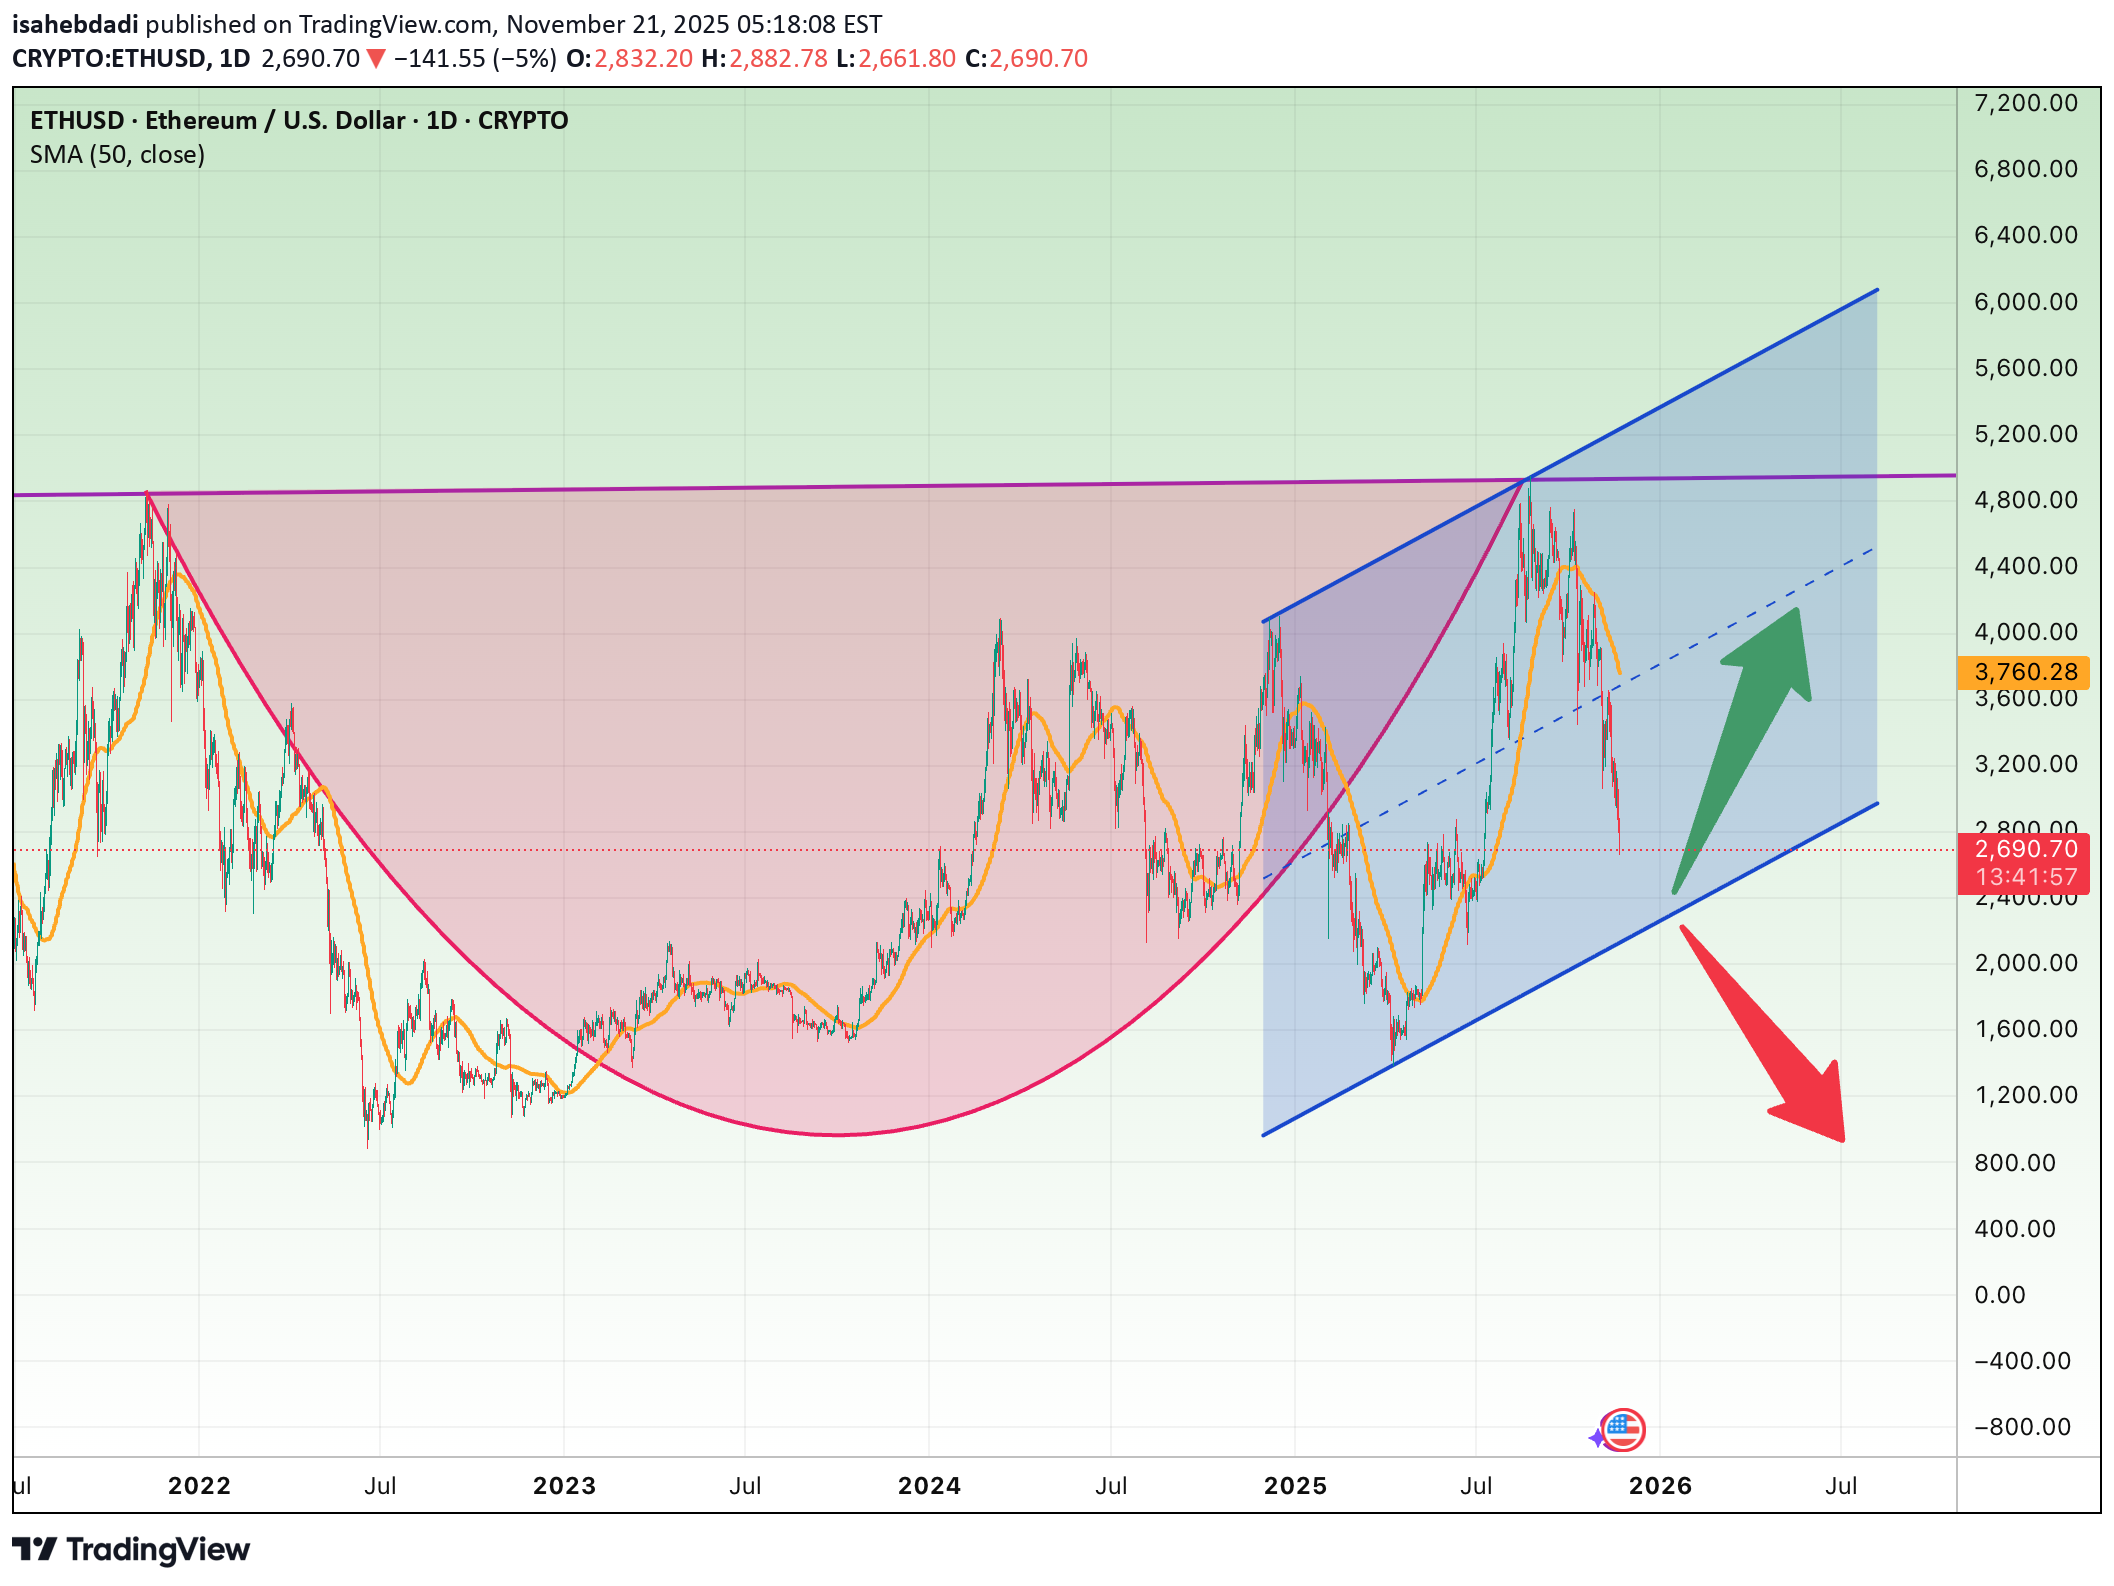
Based on your chart, Ethereum is currently sitting right on the lower boundary of the rising blue channel, which is a major decision zone for the next trend. Bullish Scenario If ETH holds the lower blue trendline (around $2,400–$2,500): Bullish Targets 1.$3,200 — mid-channel resistance 2.$3,760 — major structural resistance 3.$4,800 — historical peak & cup-and-handle breakout level 4.$5,500–$6,000 — full bullish channel extension Confirmation for upside •Strong reversal candle on the lower channel •Break & close above the 50-day SMA Bearish Scenario If ETH breaks below the lower channel (~$2,400): Bearish Targets 1.$2,000 — psychological support 2.$1,550 — major previous swing low 3.$1,000–$1,200 — full downside breakdown target Stop-Loss Recommendation (To protect against a channel breakdown) Stop-Loss: Below $2,350 This is slightly under the lower trendline — if broken, the bullish structure fails. Trading Plan Summary •Entry zone: $2,450–$2,600 (channel support region) •Stop-loss: $2,350 •Take Profit (TP): •TP1: $3,200 •TP2: $3,760 •TP3: $4,800 •TP4: $5,500–$6,000