Technical analysis by DrForexPhd about Symbol PAXG: Sell recommendation (11/18/2025)

DrForexPhd
تحلیل طلای جهانی (XAU/USD): آیا خط روند صعودی میشکند؟ سناریوی نزولی محتمل
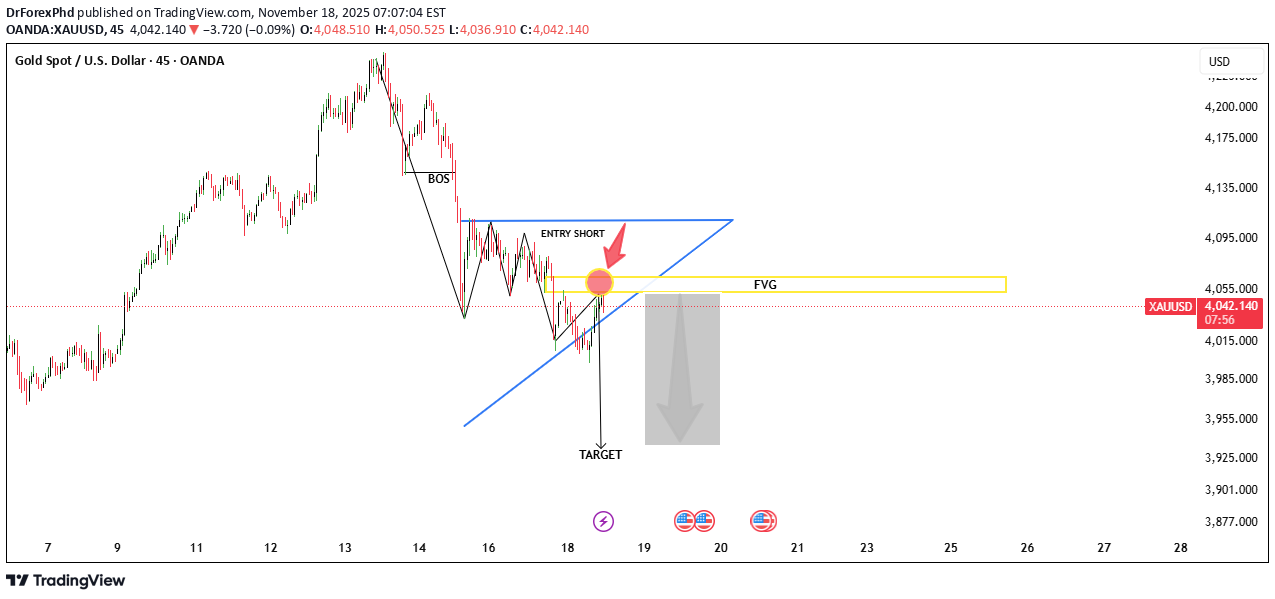
Current Market Structure & Key Observations Previous Trend: The chart shows a strong uptrend from late October, peaking around November 14th at approximately $4,400. This peak marked a significant reversal. Correction/Reversal: Since the peak, the price has undergone a sharp downward correction or potential reversal. Trendline Interaction: The price has recently fallen to and is currently interacting with a major long-term ascending trendline (the solid black line). Current Price: The price is hovering right at the trendline, indicated by the dashed pink line at approximately $4,034. Analysis of the Projected Path (Red Lines) The red lines drawn on the chart suggest a specific bearish scenario: Trendline Break and Retest: The price is shown to break below the ascending trendline. This is a critical technical signal, often indicating the end of the uptrend and the start of a downtrend. Pullback/Retest: The price then executes a pullback back up to the broken trendline (now acting as a resistance level). The projected high for this pullback is around $4,060. Bearish Continuation: After failing to break back above the trendline, the price is projected to continue its decline, heading towards the area of $3,900 and then possibly $3,850 in the following days. Potential Scenarios (Alternative View) While the red lines illustrate a clear bearish path, it's important to consider an alternative: Scenario 1: Bearish Continuation (As Projected) Action: If the price confirms a breakout below the trendline (closes below it on multiple candles), the trendline turns into resistance. Target: The focus shifts to lower support levels, with initial targets around $3,900 - $3,850. This confirms the end of the recent uptrend. Scenario 2: Trendline Hold/Bounce Action: If the trendline acts as strong support and the price fails to close significantly below it, it could lead to a bounce. Target: A bounce would target the previous swing high before the major drop, potentially aiming back toward $4,150. This would maintain the longer-term bullish structure.