Technical analysis by ROY_TRADER_007 about Symbol PAXG: Buy recommendation (11/18/2025)

ROY_TRADER_007
تحلیل طلای جهانی (XAUUSD): نقشه راه خرید، حد ضرر و اهداف سود دقیق!
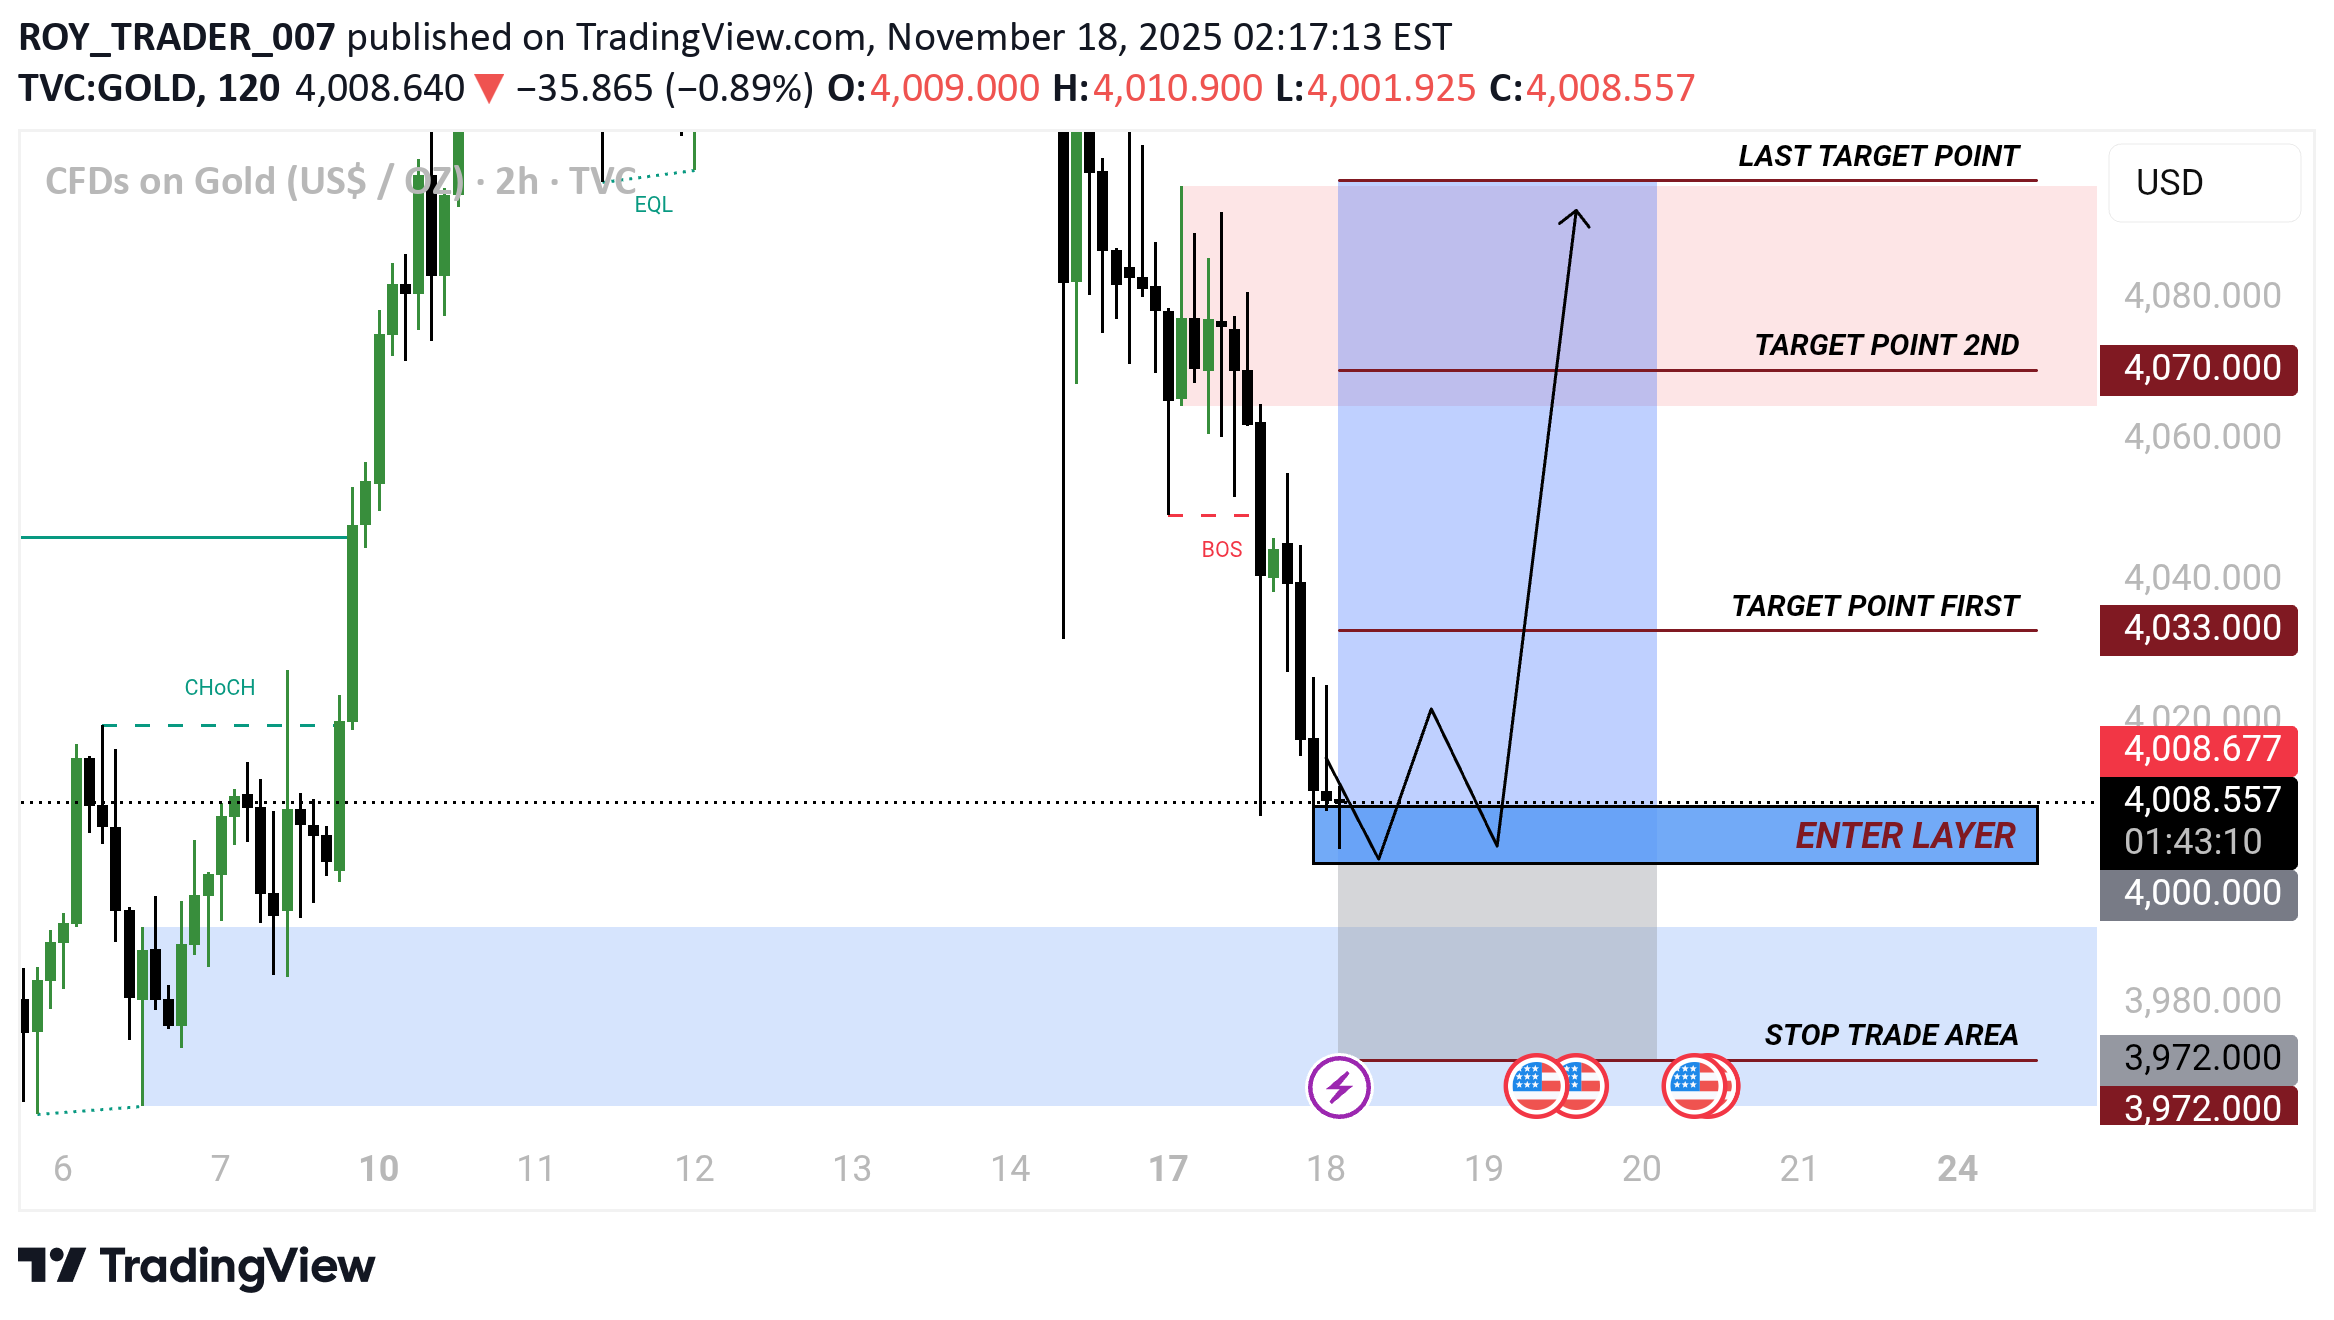
ENTER LAYER (Buy Zone) The blue zone is your demand area. Price already dropped strongly (BOS – Break of Structure), and now it is reaching a support + demand zone. The zig-zag line shows price may tap the zone, reject, and form a higher low → confirmation for entry. This is where you are supposed to place your BUY trade. STOP TRADE AREA The light blue zone below is your stop-loss area. If price falls here, the buy idea is invalid. 🎯 3. TARGET POINTS There are 3 take-profit levels: 🎯 Target 1 → 4,033 Nearest resistance Safe and quick take profit 🎯 Target 2 → 4,070 Second higher resistance area Price may react here after the bullish move Last Target Point (Top of Red Zone) The final high-probability target zone Highest profit area if the bullish momentum continues