Technical analysis by ICHIMOKUontheNILE about Symbol PAXG on 11/16/2025

ICHIMOKUontheNILE
طلا برمیگردد: تحلیل روزانه با نگاهی به عوامل کلان اقتصادی و جهش انفجاری قیمت
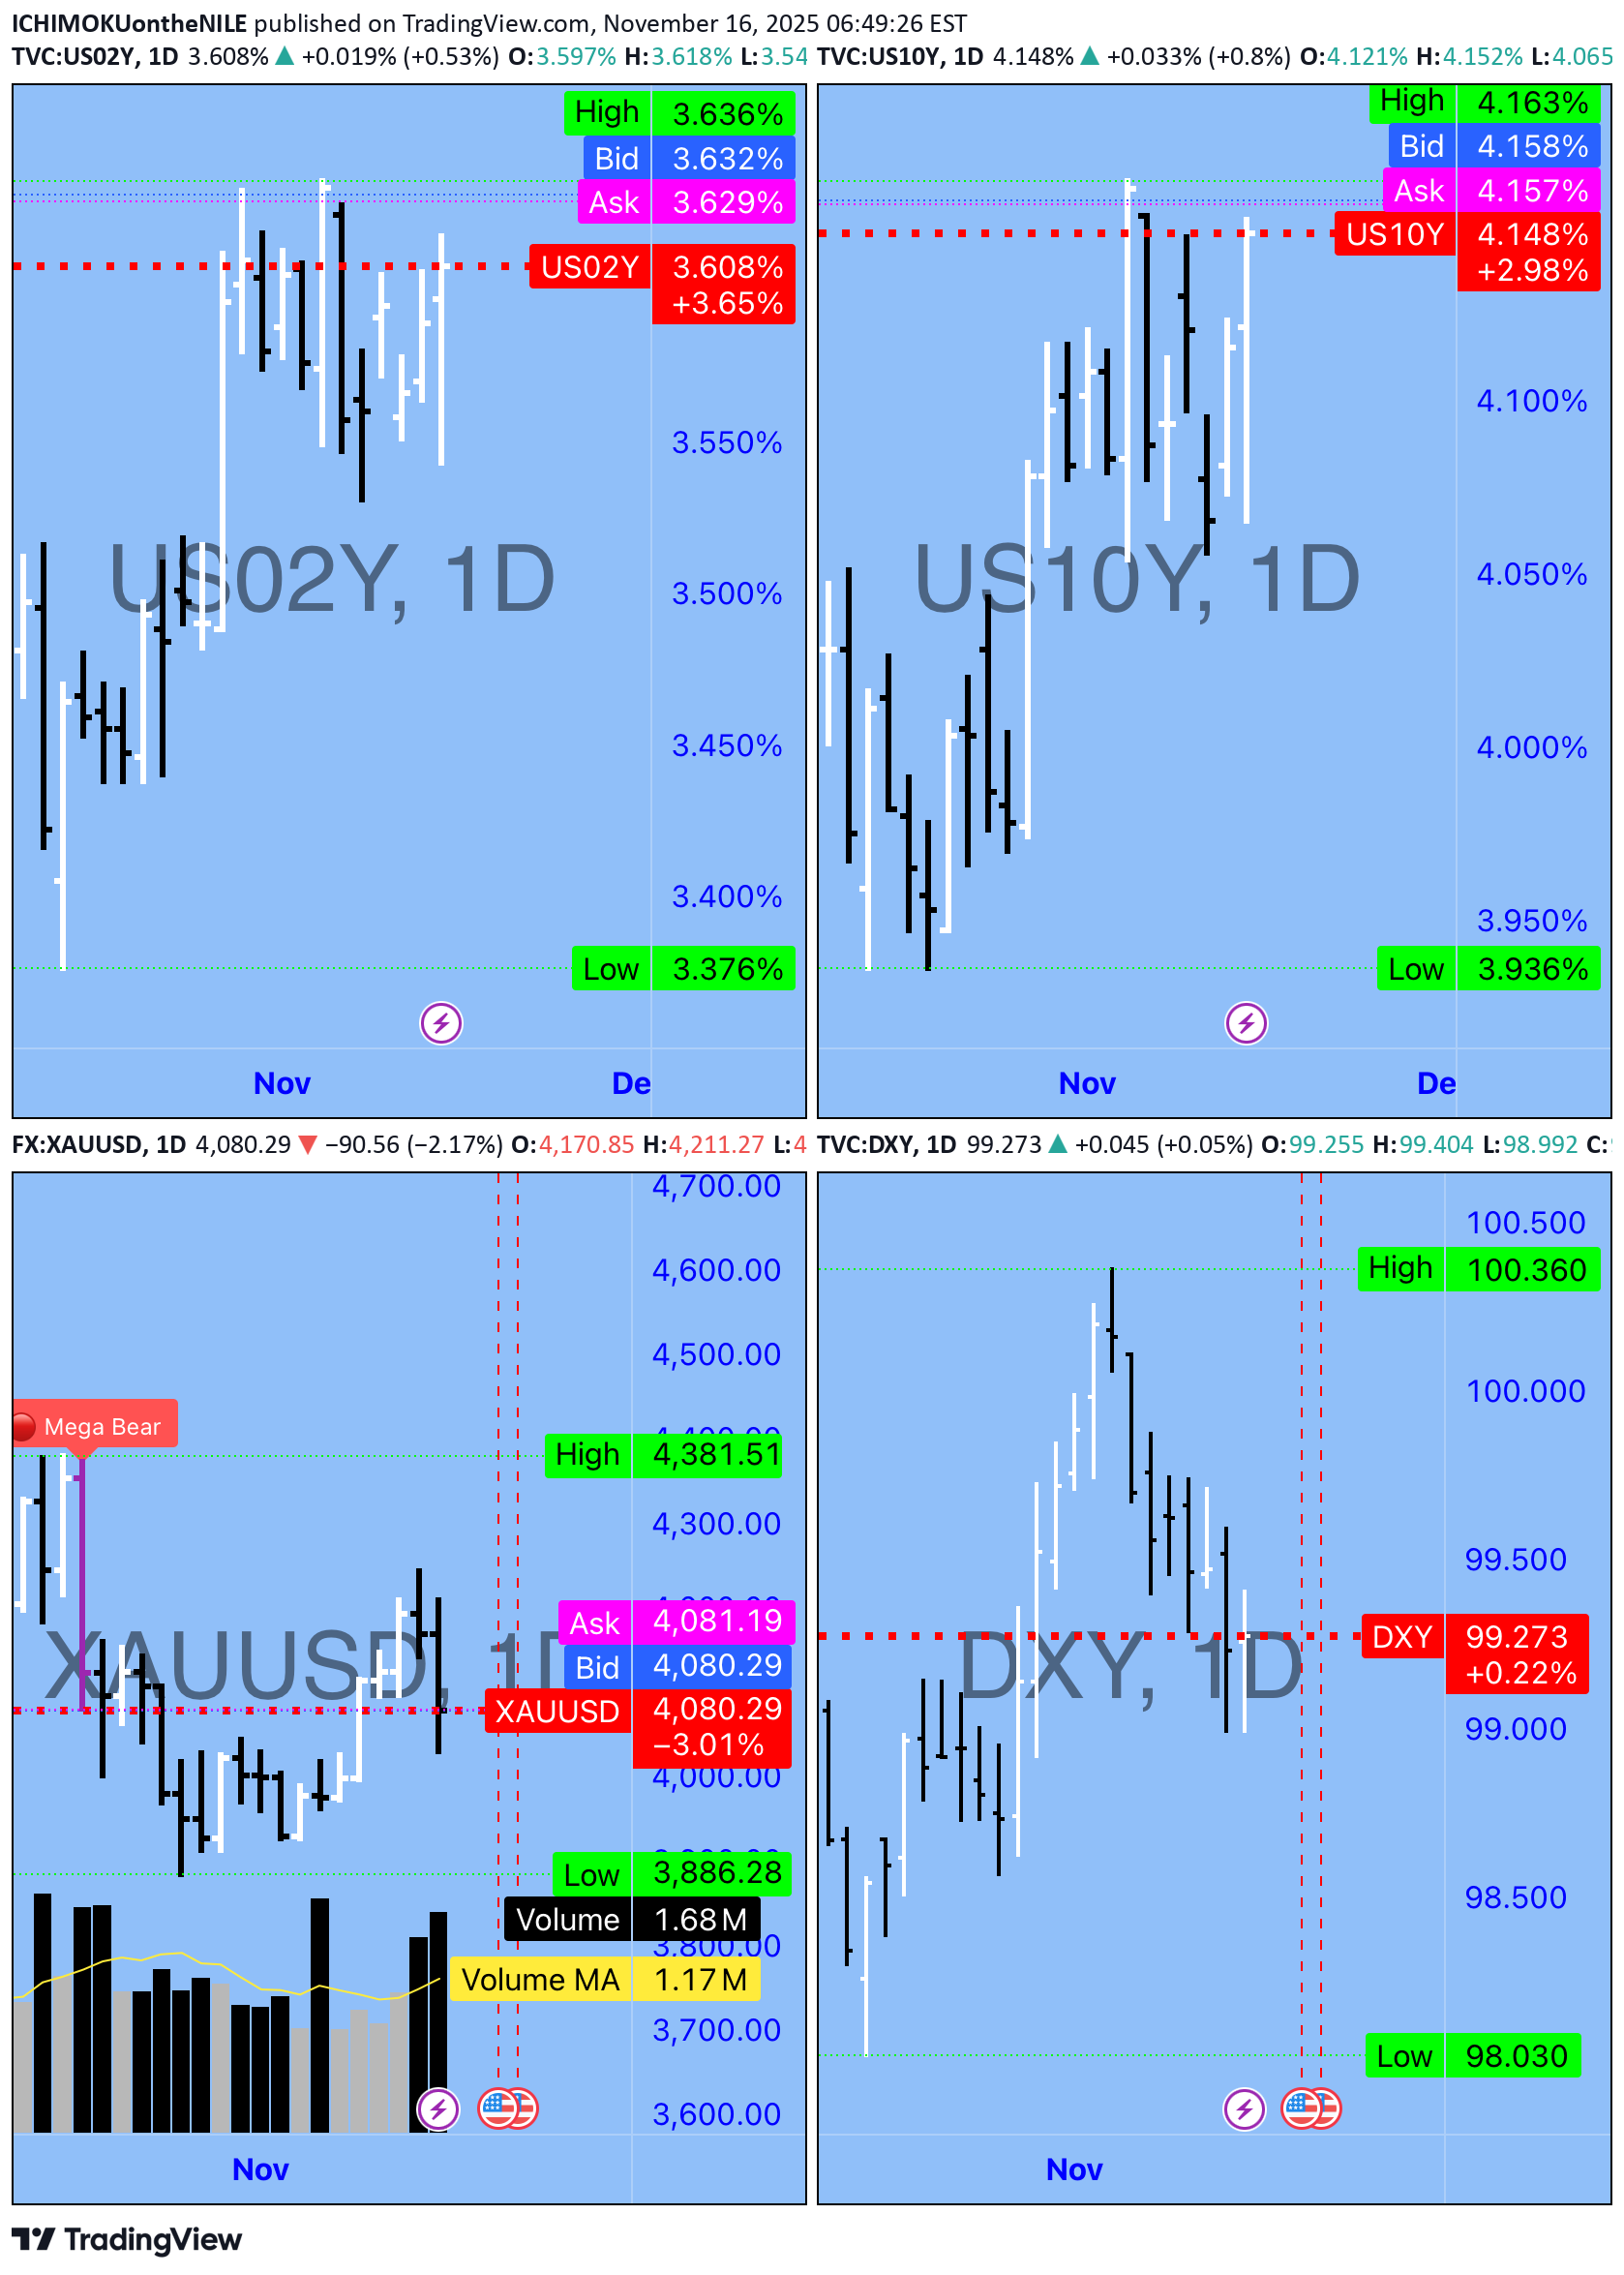
Let’s read this board step by step, then I’ll give you the gold outlook 👇 ⸻ 1️⃣ US02Y (2-year Treasuries) – top left •Timeframe: Daily (1D) •Yield is around 3.60% (shown 3.608%) and slightly down today (-0.19%). •Price is still close to the recent high, and the red dotted line = resistance / overbought zone. 👉 Meaning: •The Fed is still in “high rates” mode, •but this small drop in yield shows a bit of relief, so the pressure from bond yields on gold has eased a little but hasn’t disappeared. ⸻ 2️⃣ US10Y (10-year Treasuries) – top right •Yield is around 4.15%, also down today (-0.24%). •Still close to recent highs, just under a red dotted line (resistance). 👉 Meaning: •Long-term yields are still high, but we see a small downward breathing move. •If that continues, it helps gold, because the “opportunity cost” of holding gold decreases. ⸻ 3️⃣ DXY (US Dollar Index) – bottom right •Timeframe: Daily. •Recent high is around 100.36. •Current price is about 99.27 with a daily gain of +1.61%, but the chart clearly shows a short-term downtrend from the 100.36 top, drifting lower. 👉 Meaning: •The dollar is still strong in absolute terms, •but it is losing upside momentum above 100. •If the DXY continues to drop, that is usually positive for gold. ⸻ 4️⃣ XAUUSD (Gold) – bottom left •Timeframe: Daily (1D). •Today we have a strong bullish candle: •Current price is around 4,080. •Daily change +5.76% → an explosive day (short squeeze + aggressive buying). •Today’s low: around 3,819; high: around 4,381 → a very wide candle. •Volume: 1.68M vs Volume MA 1.17M → volume well above average → this move is not random; it’s a “big money” move. •Red dotted line around 4,080 → a key level / previous fair value, and price is now at or slightly above it. ⸻ Reading the full picture (Macro + Gold) 1️⃣ 2Y & 10Y yields •Still at elevated levels → in principle, that’s not great for gold, •But today’s drop in both yields tells us the market is cooling rate-hike expectations a bit → this becomes a supportive factor for gold if it continues. 2️⃣ Dollar (DXY) •Topped around 100.36, then started to calm down and pull back, even though today’s candle is green (+1.61%). •The bigger story: short-term downtrend from the top → tilts in favor of gold if the downside continues. 3️⃣ Gold (XAUUSD) itself •It went through a correction in late October / early November, •Then today you’ve got an explosive bullish candle with strong volume that pushed price back above the key level (red line). •This is typically the shape of a powerful reversal bar inside a larger uptrend (higher low + higher high). ⸻ Gold outlook from this chart (educational only) 🧭 ✅ Bullish scenario (upside bias) As long as gold: •Closes daily above the 4,000–4,050 zone (around the red dotted line), → we can say there is a re-claim of that zone after it acted as resistance / pressure. What we might see: •Retest of the 4,000–4,050 area as support, •Then another push up toward 4,250–4,380 (roughly the top of the current candle / a higher supply zone). This scenario gets stronger if: •US02Y and US10Y keep drifting lower, •DXY continues down below 99 again. ⸻ ⚠️ Bearish scenario (another correction) If gold: •Closes back below 4,000 on the daily chart, •And at the same time: •Bond yields break to new highs again, •DXY moves back above 100.36, → then today’s candle would likely be just a temporary short squeeze, and we could revisit the 3,880–3,820 area as support / re-accumulation zone. ⸻ One-sentence summary The chart says: Gold has printed a strong bullish reversal on the daily with big volume, in a macro environment that’s still not perfect but starting to ease (yields ticking down a bit and the dollar losing strength above 100). If it holds above 4,000–4,050, the outlook is tilted to the upside, with potential toward 4,250–4,380 in the short term. A break back below 4,000 would favor a return of the correction toward 3,880–3,820. (All of this is educational chart analysis only, not a buy or sell recommendation.)