Technical analysis by DrForexPhd about Symbol BTC: Buy recommendation (11/16/2025)

DrForexPhd
بیت کوین به ۱۰۰ هزار دلار میرسد؟ تحلیل الگوی پَنانت در تایم فریم ۴۵ دقیقهای
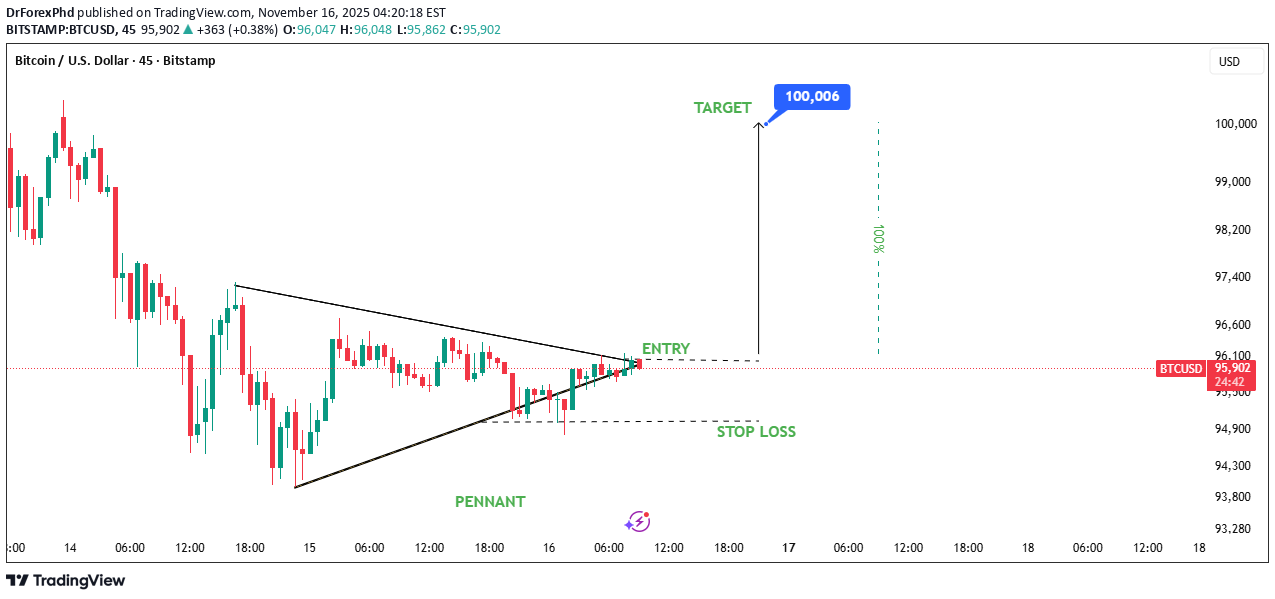
1. Pattern Formation: Bullish Pennant The chart shows a pennant, formed after a sharp downward move followed by price compression. The upper trendline is descending, the lower trendline ascending, converging into a tightening triangle. This is typically a continuation pattern, but because the preceding move was downward, traders will often wait for confirmation from the breakout direction. 2. Breakout Attempt The price is breaking slightly above the upper trendline, marked as ENTRY. This suggests a potential bullish breakout, but: The breakout candle is still small. Ideally, you’d want volume confirmation (not shown in the image). 3. Stop-Loss Placement The STOP LOSS is placed safely under: The lower pennant trendline Recent consolidation lows This gives a logical invalidation level—if price drops below this, the breakout has failed. 4. Target Projection The target of $100,006 is consistent with a measured move calculation: Height of the initial impulse (the pole) Added to the breakout point On your chart, the projected move equals about +10%, also labeled on the right. 5. Risk–Reward The setup shows good R:R, since: Stop-loss is close Target is distant However, pennants can generate fakeouts, so caution is warranted. 6. Market Context (from the chart only) Current price around $95,984. The overall trend in the 45-minute view appears mixed: Strong drop earlier Stabilization Compression The breakout direction will determine the next phase.