Technical analysis by BlackMarketButcher about Symbol BTC on 13 hour ago

BlackMarketButcher
روش شخصی من برای تحلیل نمودار بیتکوین، سولانا و سویی: ابزارها و تریگرهای معاملاتی
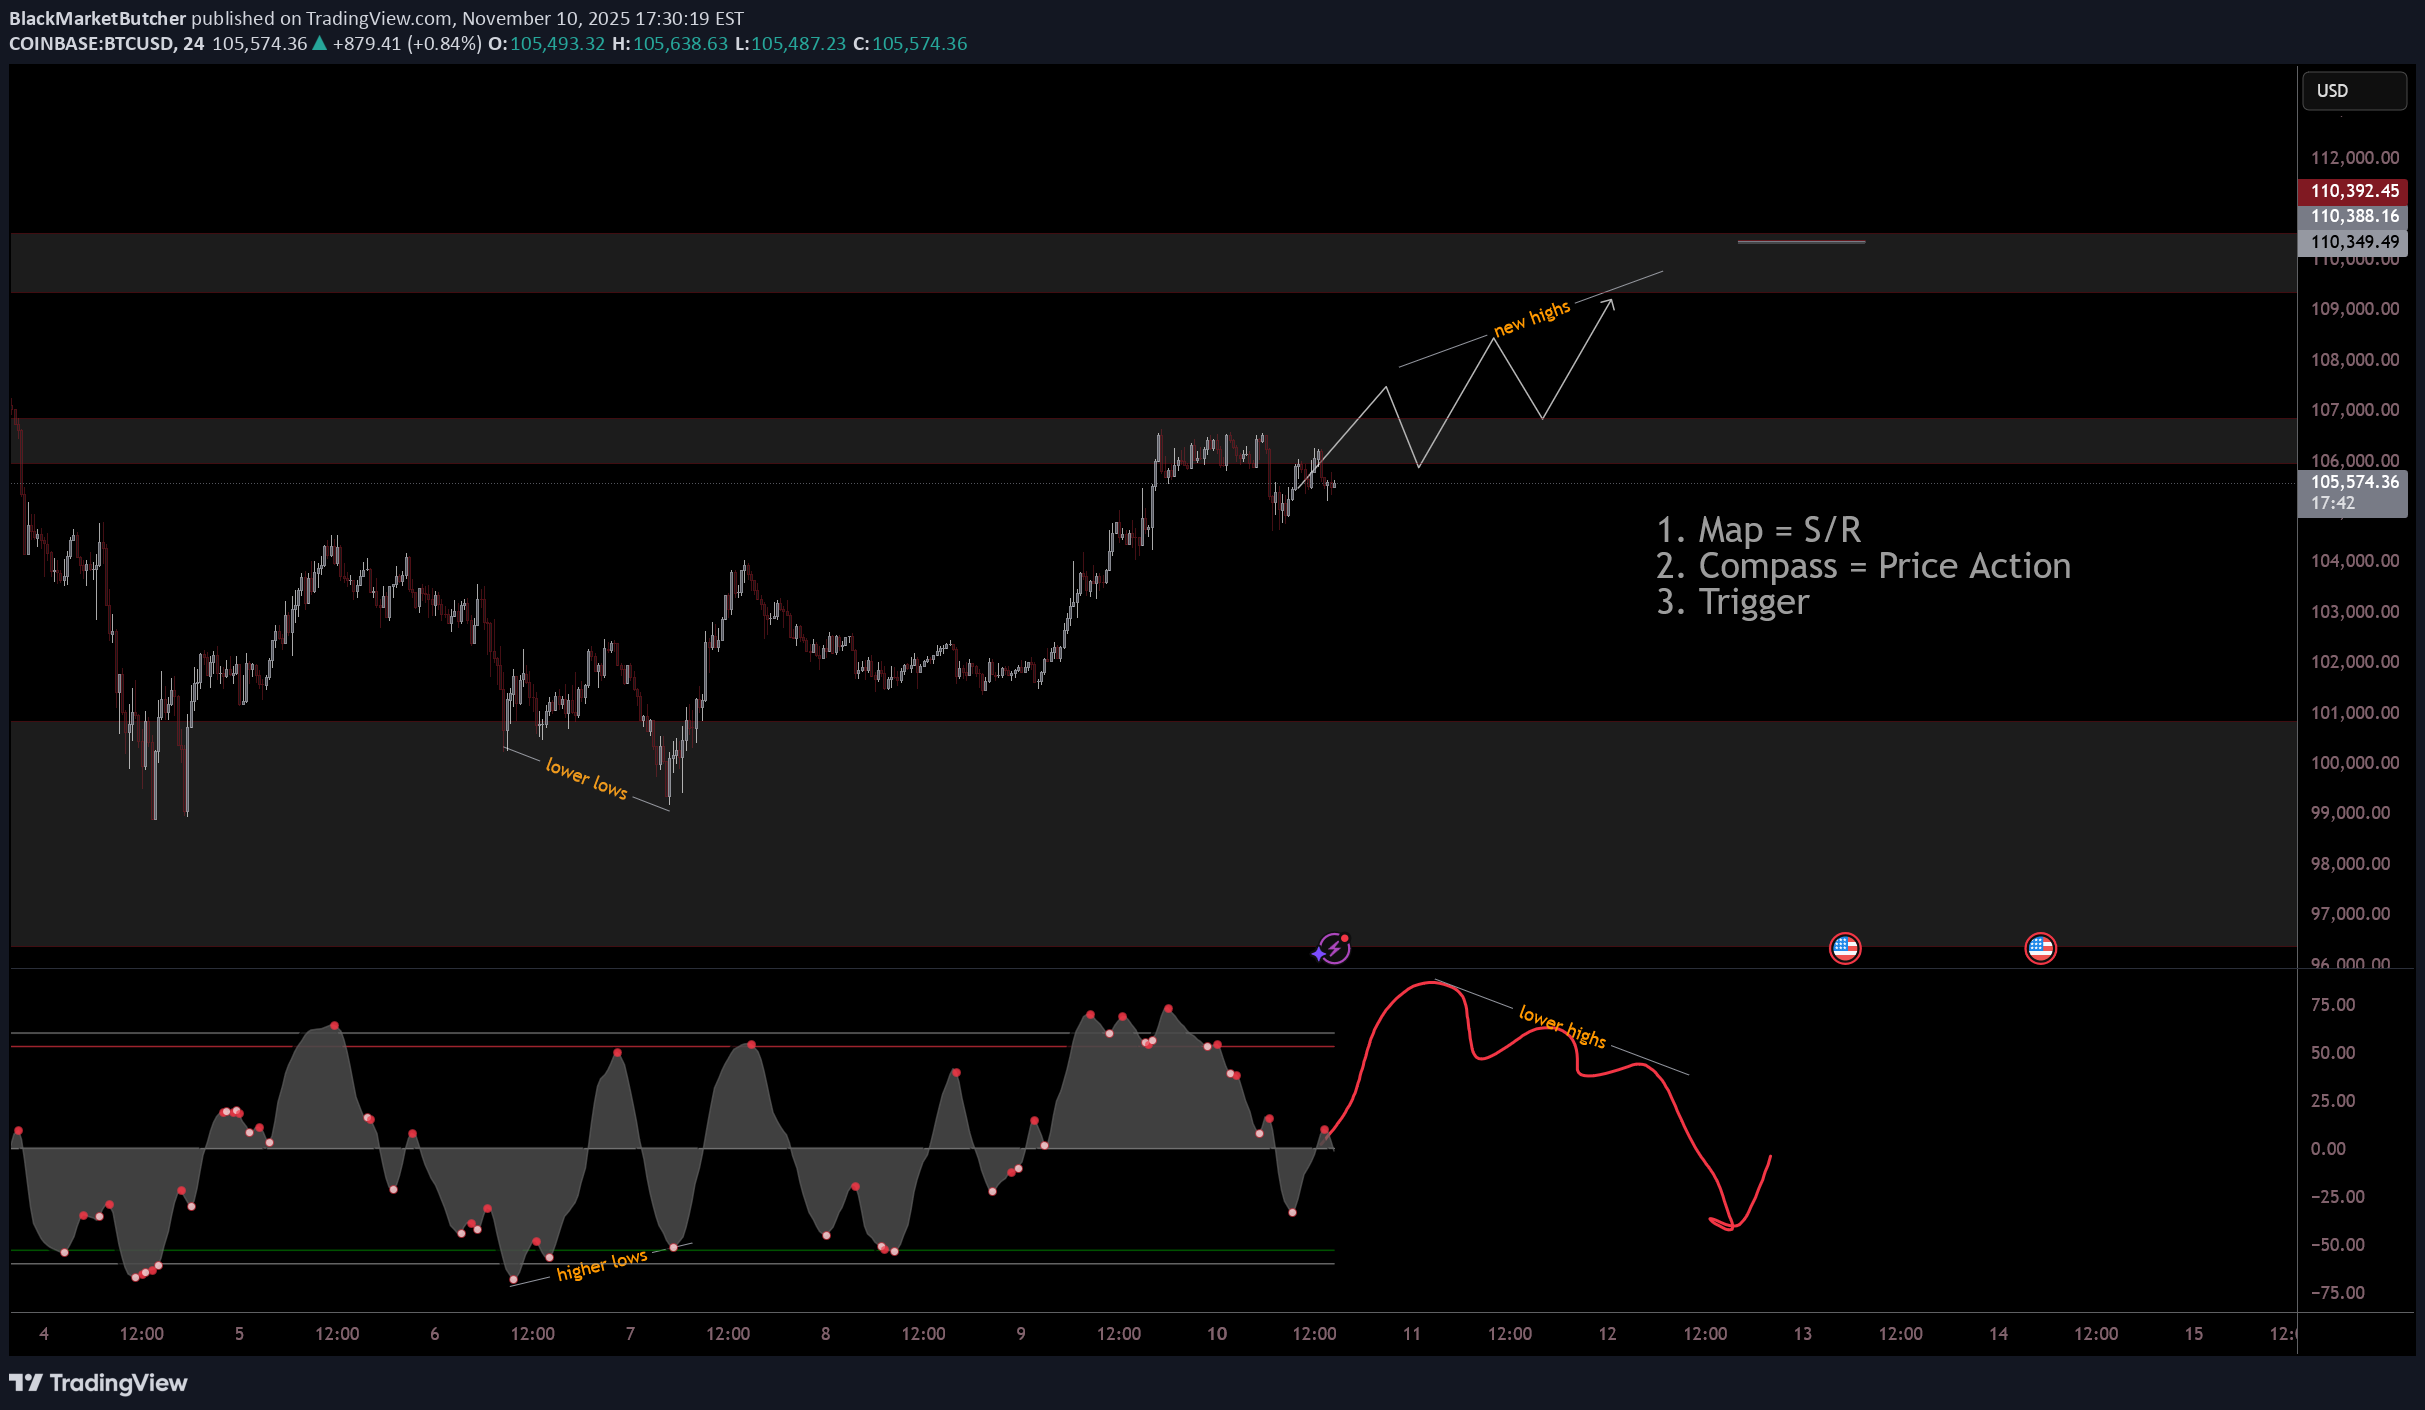
Very Brief overview of how I chart in tradingview. All scripts displayed in this video are publicly available in tradingview. 1. What I use to set up points of interest on the chart (MAP) 2. How I try to identify price direction (Compass) 3. What I use as a trigger to enter trades (Trigger) (MAP) I use psychological support and resistances using the monthly, weekly, and daily time frames. I then pull FIB levels using the 0.65, 0.618, and the 0.786 levels Lastly I use the fixed range volume profile tool to identify value area highs, value area lows, and the Point of Control from the 1 month, 6 month, and yearly time frame. (Compass) I use basic price action to determine possible price direction. Uptrends, downtrends, and ranges. (Triggers) Public scripts that include RSI or the Lazy Bear Indicator to identify price divergence. Like all strategies, this is not perfect. It just helps me make decisions and come up with my bias towards the market. It helps me with planning and execution. Maybe something in this video may give you ideas or help others identify tools that they have not studied yet.