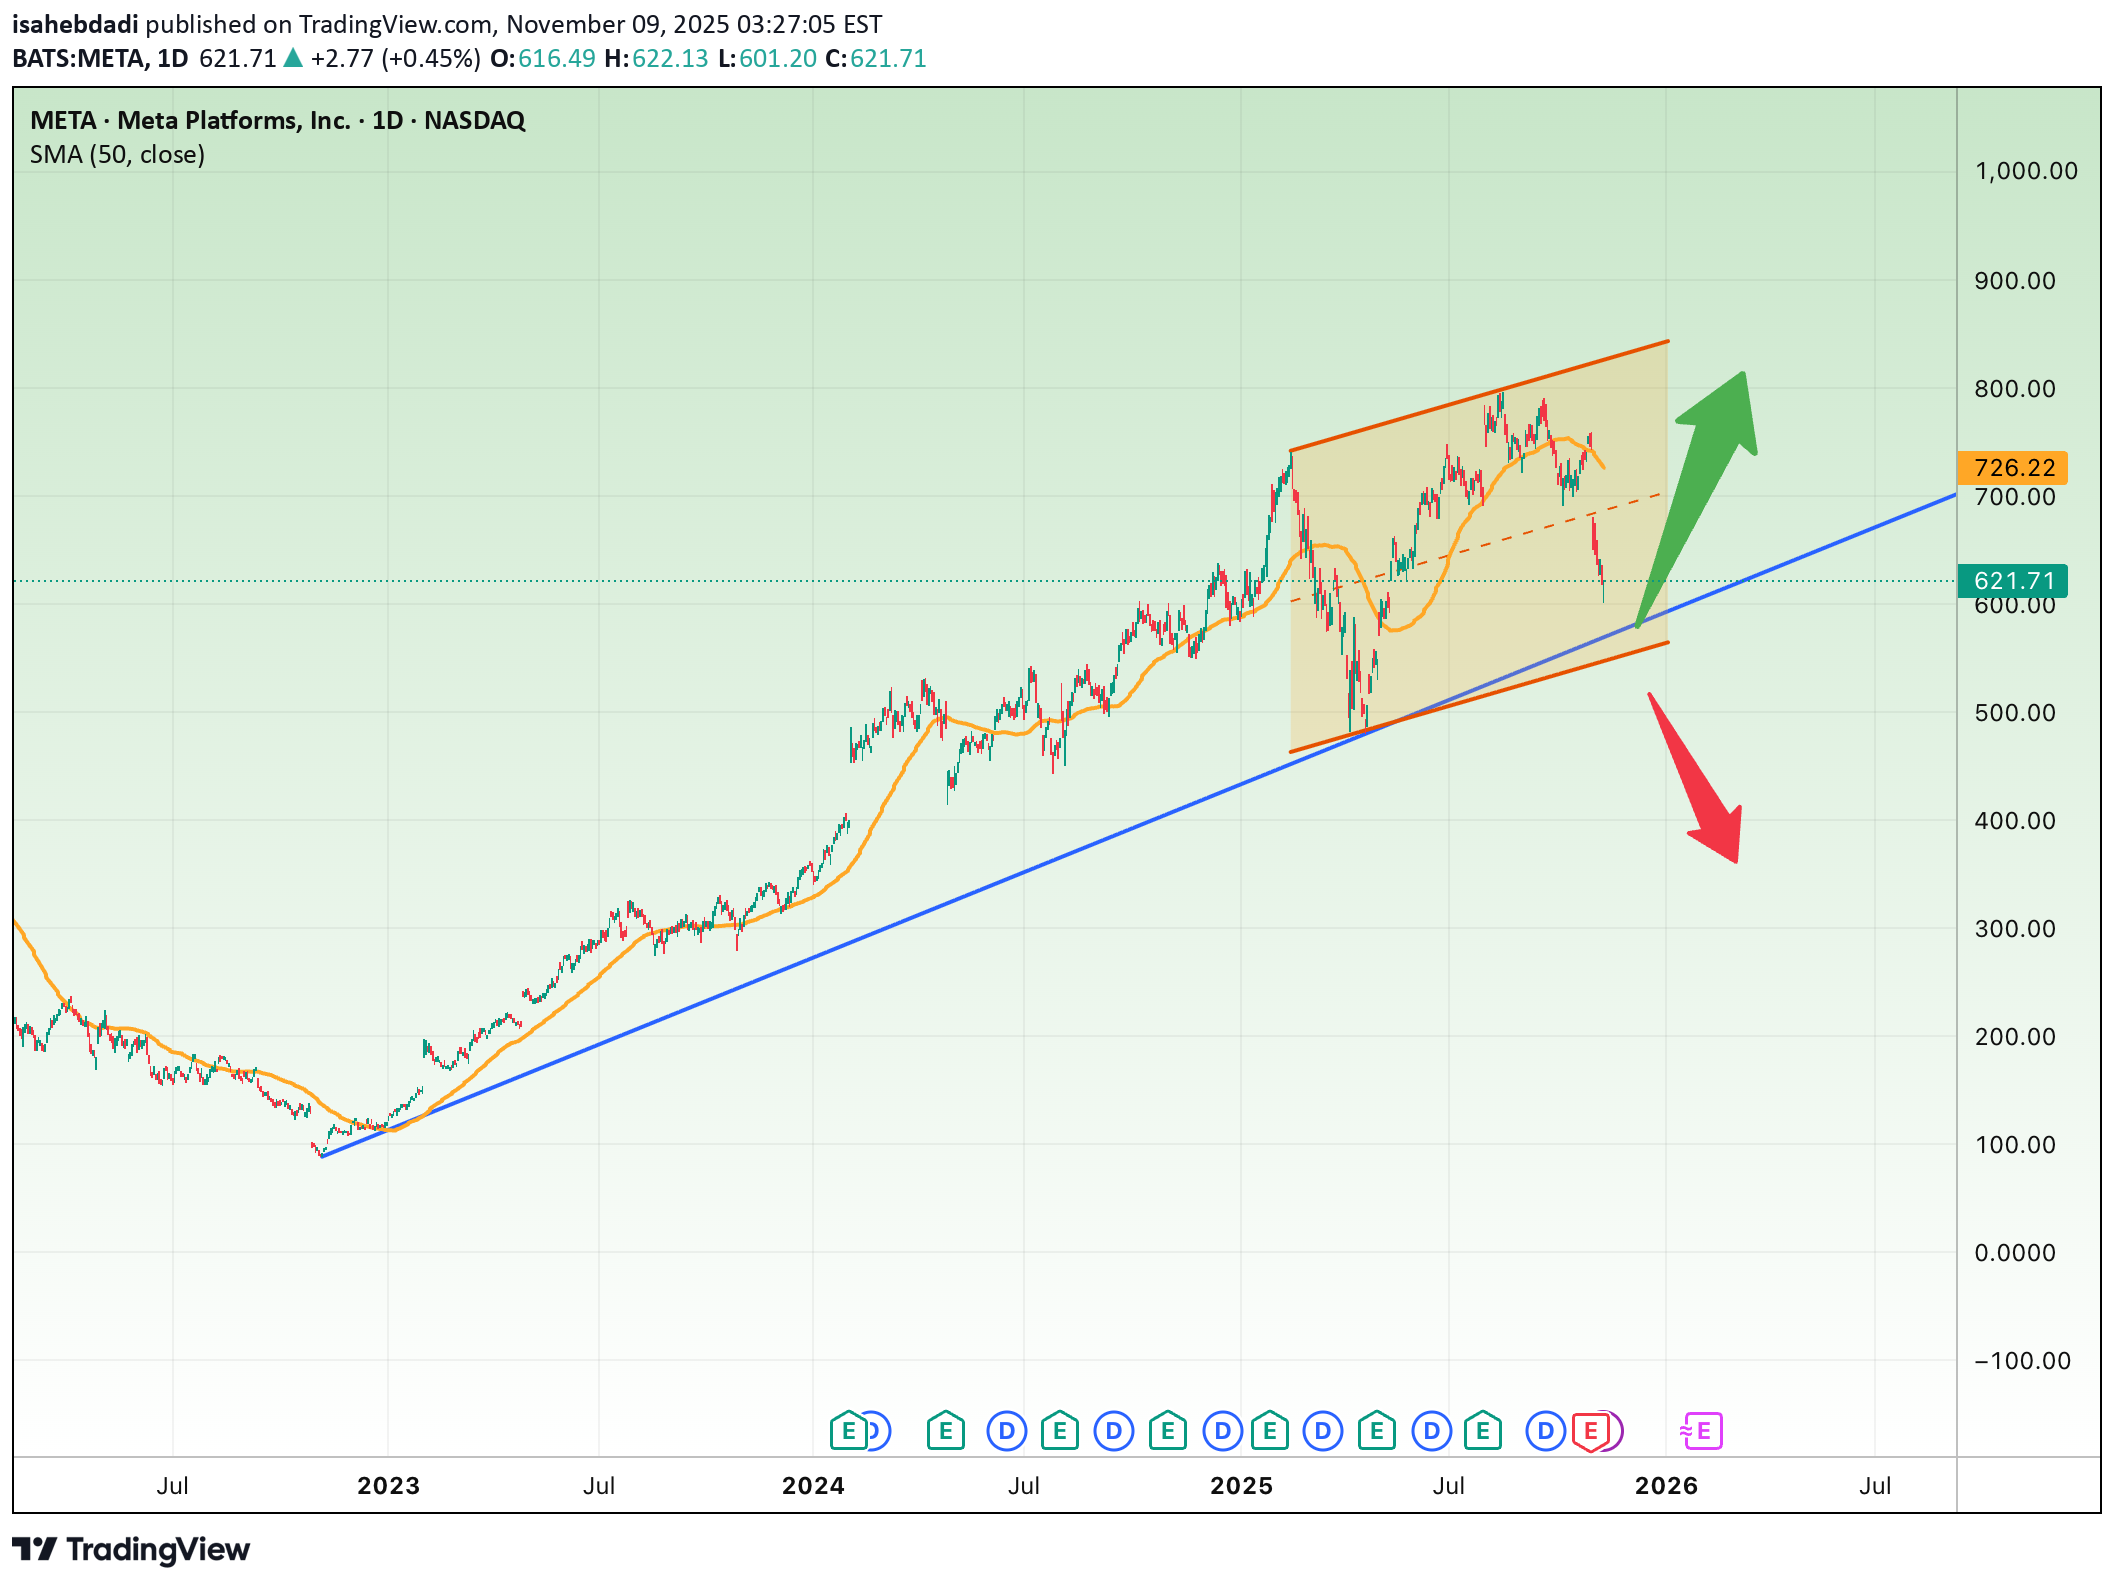
Technical analysis by isahebdadi about Symbol METAX: Buy recommendation (11/9/2025)

isahebdadi
سهام متا (META) در یک نقطه حیاتی: آیا روند صعودی ادامه مییابد یا اصلاح آغاز میشود؟

On the daily chart, META stock has been trading within a rising short-term channel after a strong uptrend from early 2023 to mid-2024. The price is now around $620, approaching the main long-term uptrend line (blue) drawn from the 2023 lows — a critical level that also aligns with the 50-day moving average (SMA50). Bullish Scenario: If META holds the $600–$630 support zone and forms a bullish reversal candle, a rebound toward $725 and potentially $800 could follow. This would confirm the continuation of the long-term uptrend. Bearish Scenario: If the trendline fails and the price closes below $580, a deeper correction toward $500 is likely. Such a breakdown would indicate the start of a medium-term consolidation phase. Summary: The $600 zone is the critical decision point — the line between trend continuation and correction. As long as META trades above this level, the broader market structure remains bullish.