Technical analysis by isahebdadi about Symbol TSLAX: Buy recommendation (11/8/2025)

isahebdadi
تسلای تسلا در دوراهی سرنوشتساز: آیا قیمت به مرز ۴۵۰ دلار حمله میکند؟
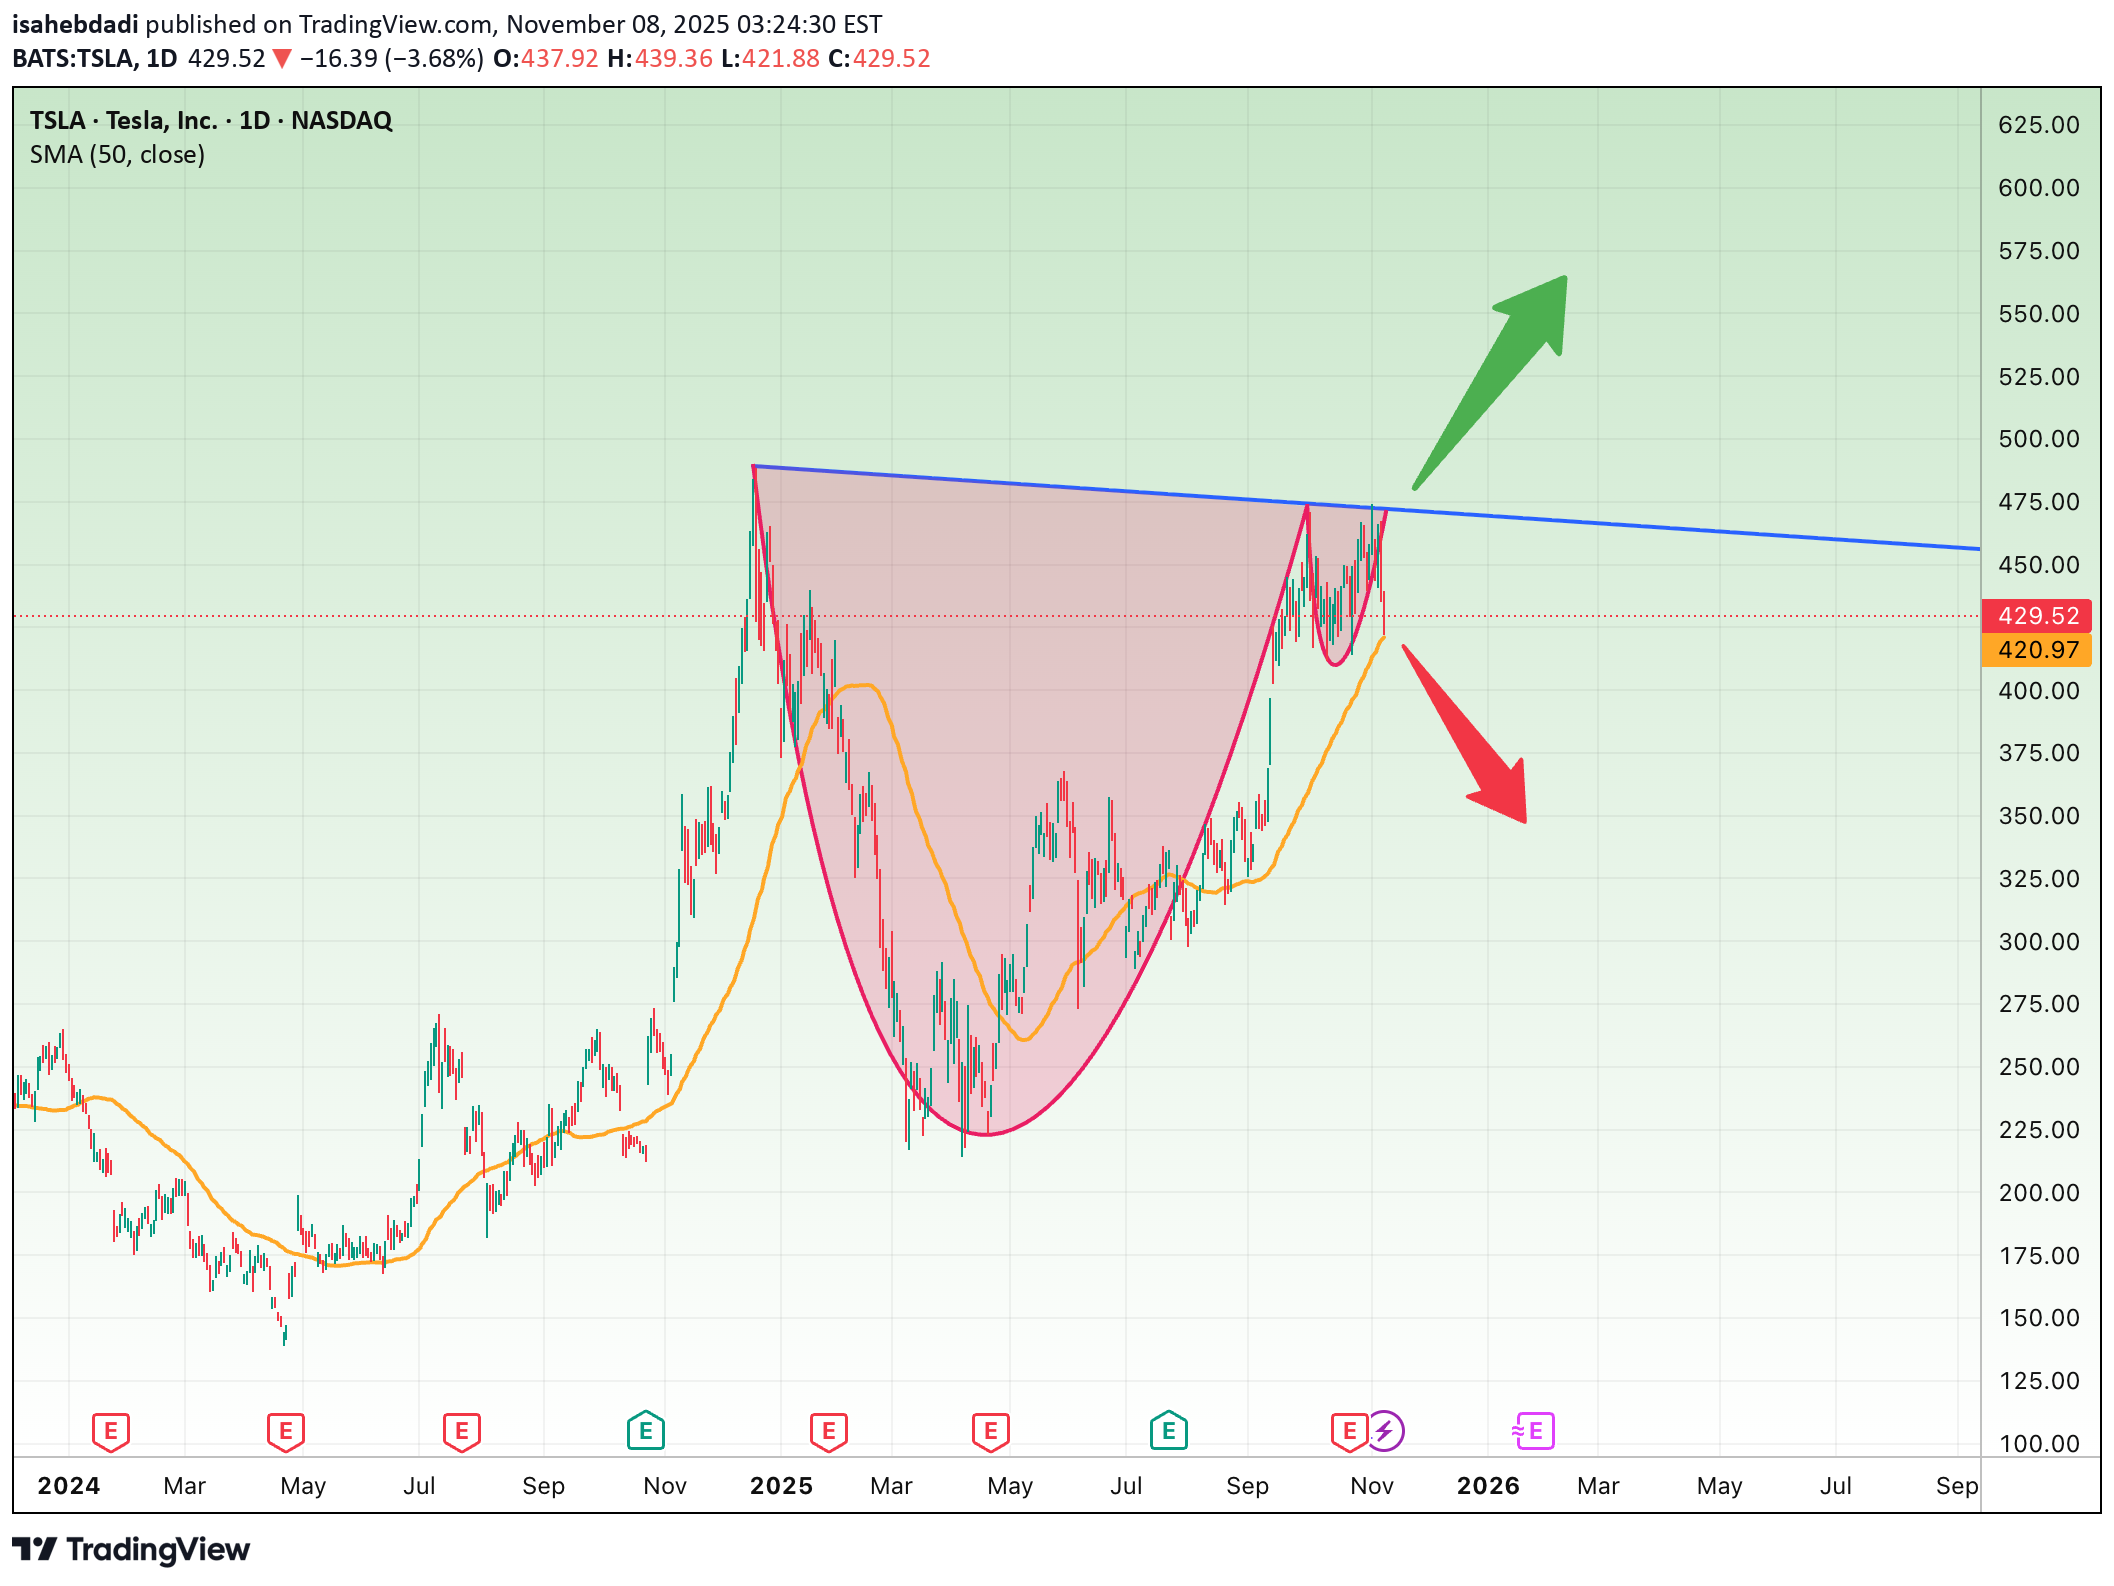
The Tesla (TSLA) daily chart shows a classic Cup & Handle pattern nearing a critical resistance zone. The key level sits around $450, aligning with a long-term descending trendline (in blue). Technical Overview: General Trend: Since early 2025, TSLA has been in a steady uptrend. The 50-day moving average (SMA 50) near $220 acts as strong dynamic support and is still trending upward. The structure indicates Tesla is finishing the “handle” phase of the pattern — a decisive moment is approaching. Bullish Scenario: If the price breaks and holds above $450 with strong volume, it would confirm the Cup & Handle breakout. Potential upside targets: Short-term target: $503 Mid to long-term target: $565 (based on cup depth projection) Stop loss: Below $410 A breakout above $450 could trigger a strong continuation rally as investors re-enter on technical confirmation. Bearish Scenario: Failure to break above $450 and a drop below $410 could invalidate the bullish setup, leading to a deeper correction. Potential downside targets: Short-term target: $375 Long-term target: $320 Stop loss: A confirmed close back above $445 This would suggest that the handle failed, and selling pressure could accelerate toward lower supports. Timeframe Summary: Short-term (1–3 weeks): Expect consolidation between $410–$450, with bias toward a breakout if the tech sector remains strong. Long-term (3–6 months): A confirmed breakout above $450 opens the path toward $565. If rejected, expect a correction toward $375, possibly forming a new accumulation base.