Technical analysis by coinpediamarkets about Symbol SOL on 11/8/2025

تشکیل کف دوقلو در سولانا (SOL): سیگنال صعودی قوی از منطقه تقاضا!
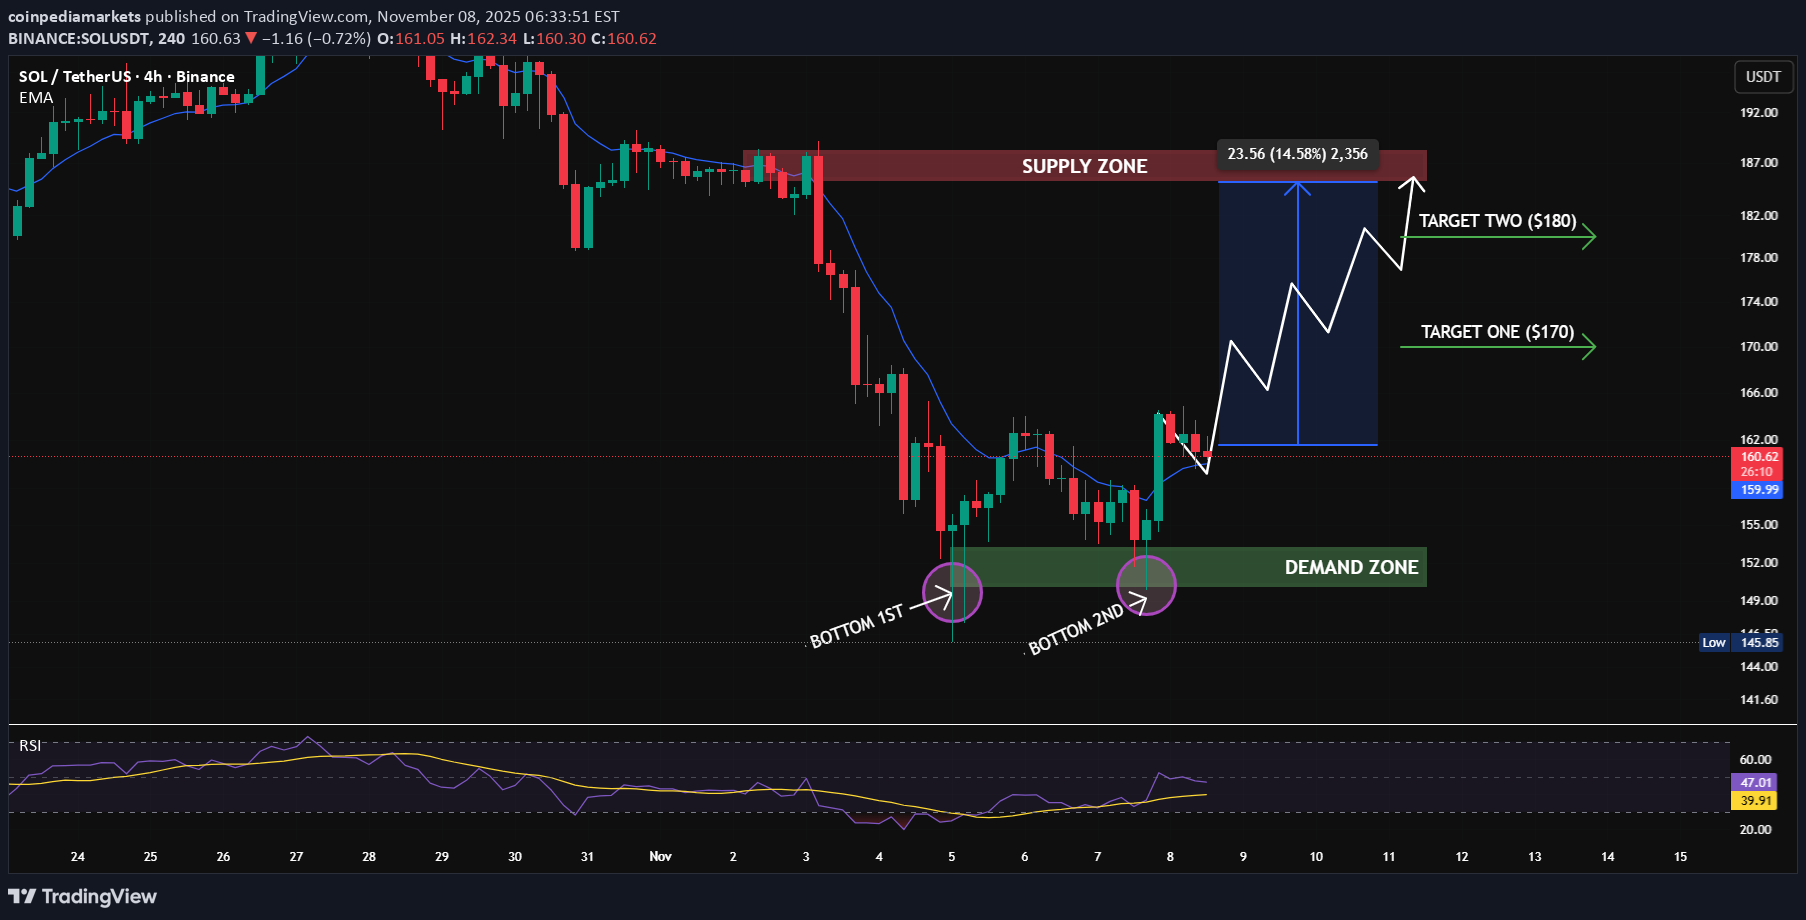
The chart shows SOL forming a double bottom at a strong demand zone, indicating a potential bullish reversal. Price has bounced twice from the same support region, showing clear buyer aggression and seller exhaustion, with a projected move toward the upper supply zone. Key Observations 🔹 Demand Zone: $148 – $152 — strong support where both bottoms formed, triggering buyer interest. 🔹 Double Bottom Formation: Two clean touches confirming reversal structure. 🔹 Supply Zone: $183 – $187 — key resistance where sellers may step in. 🔹 EMA (10): Price is attempting to reclaim it; a close above the EMA would confirm momentum shift. 🔹 RSI: Currently around 47 — rising from lower levels, signaling early bullish momentum with room to move higher. 🔹 Structure: As long as SOL holds above the demand zone, the bullish reversal setup remains intact. Potential Move If SOL continues to hold above the $148–$152 demand zone, the next upside targets are: 🎯 Target 1: $170 🎯 Target 2: $180 A breakdown below $148 could invalidate the reversal and push the price back toward deeper support levels. Summary: SOL is showing a strong double-bottom reversal from a key demand zone, supported by improving RSI and EMA interaction. Holding above $150 keeps the bullish structure active, with a potential continuation move toward $170–$180, followed by a retest of the supply zone near $185. . . #coinpediamarkets #SOL #SOLUSDT #CryptoAnalysis #TechnicalAnalysis #Altcoins #DemandZone #SupplyZone #BullishTrend