Technical analysis by VasilyTrader about Symbol PAXG on 11/8/2025

VasilyTrader
استراتژی خفن فیبوناچی برای مبتدیان: پولسازی در طلا و فارکس با وینریت بالای 60%!
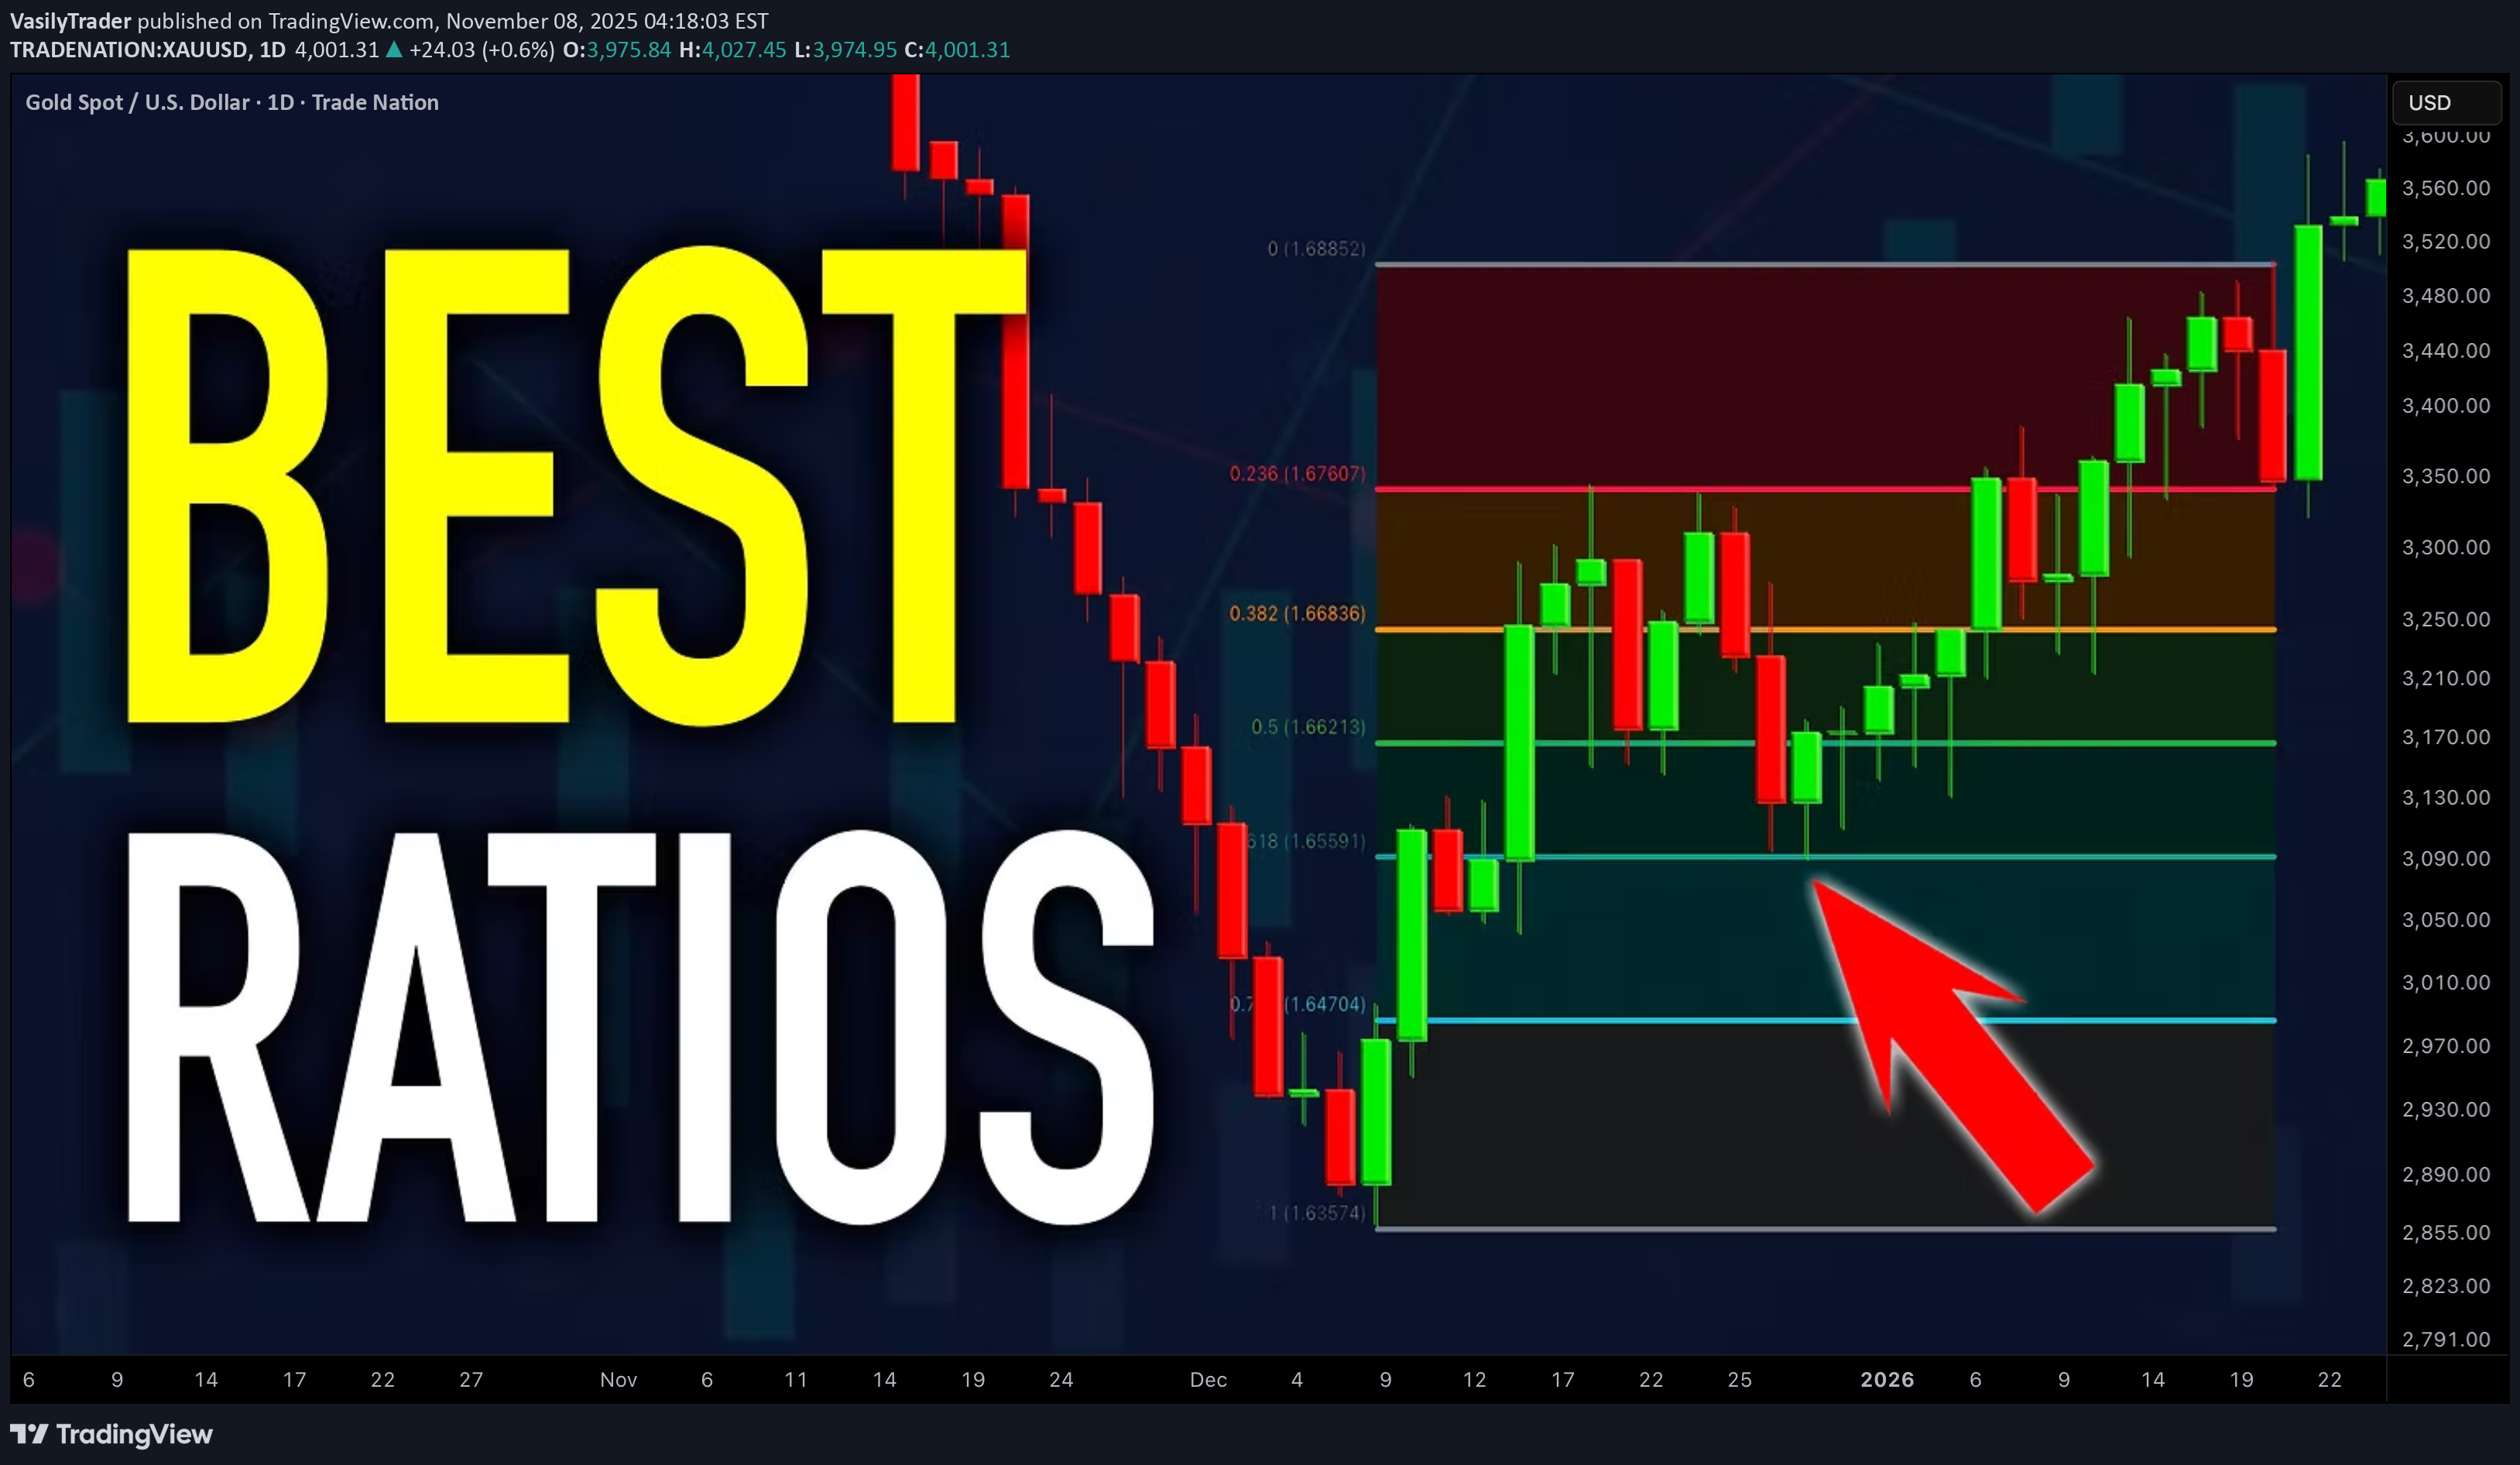
I am going to reveal a powerful fibonacci trading strategy that I learned many years ago. It combines structure analysis, fibonacci retracement and extension levels and candlestick analysis, and it is suitable for beginners. Step 1 Find a trending market - the market that is trading in a bullish or in a bearish trend on a daily time frame. AUDUSD is trading in a bullish trend on a daily. Step 2 Execute structure analysis - identify key horizontal and vertical structures on a daily time frame. Have a look at key structures that I spotted on AUDUSD. Step 3 Draw fibonacci retracement levels. Here are the important ratios you should look for: 382, 50, 618, 786. In a bearish trend, draw fibonacci retracement levels from the high of the trend to current low based on wicks. In a bullish trend, You should apply fibonacci retracement from the low of the trend to a current high based on wicks. Take a look how I draw the retracement levels, I took the low of the trend and the high of the trend. Step 4 Find confluence . Look for fibonacci numbers that match - lie within key structures that you identified. Support 1 matches with 382 retracement. Support 2 matches with 786 retracement. Remove other ratios from the chart. Step 5 Wait for a test of one of the fibonacci levels that match with key structure The price perfectly tested 382 retracement level. Step 6 Wait for a confirmation on a 4h time frame. Our confirmation will be a formation of an engulfing candle - a strong candle that completely engulfs the entire range of a previous candle with its body. In a bearish trend, we will look for a formation of a bearish engulfing candle. Bearish engulfing candle indicates a strong selling pressure and the strength of the sellers. In a bullish trend, we will look for a bullish engulfing candle. It indicates a strong buying reaction and imbalance. Have a look at a bullish engulfing candle that was formed on AUDUSD on a 4H time frame after a test of 382 retracement. Step 7 Open a trading position, set stop loss and choose the target. After you spotted an engulfing candle, open a trading position. Open short after a formation of a bearish engulfing candle and open long after a formation of a bullish engulfing candle. If you sell , your safest stop loss will be 1.272 extension of the last bullish impulse on a 4H. If you buy , your stop loss will be 1.272 extension of the last bearish impulse on a 4H. In our example, our stop loss will be 1.272 extension of a bearish impulse leg on a 4H time frame. The extension is based on high and low of the impulse. If you short , your take profit will be the closest key structure support on a daily. If you buy , your take profit will be the closest key structure resistanc e on a daily. Being applied properly, the strategy should generate 60%+ winning rate. Always remember to check your reward to risk ratio before you open the trade. It should be at least 1.1/1. Also, before you place a trade, always make sure that you trade WITH the trend and take only trend-following trades. The strategy works perfectly on Forex, Gold, Silver, Oil, Indexes. Good luck in your trading. ❤️Please, support my work with like, thank you!❤️ I am part of Trade Nation's Influencer program and receive a monthly fee for using their TradingView charts in my analysis.