Technical analysis by ManiMarkets about Symbol PAXG on 11/6/2025

ManiMarkets
طلا در نقطه حساس: آیا الگوی سقف دوقلو قیمت را سقوط میدهد؟
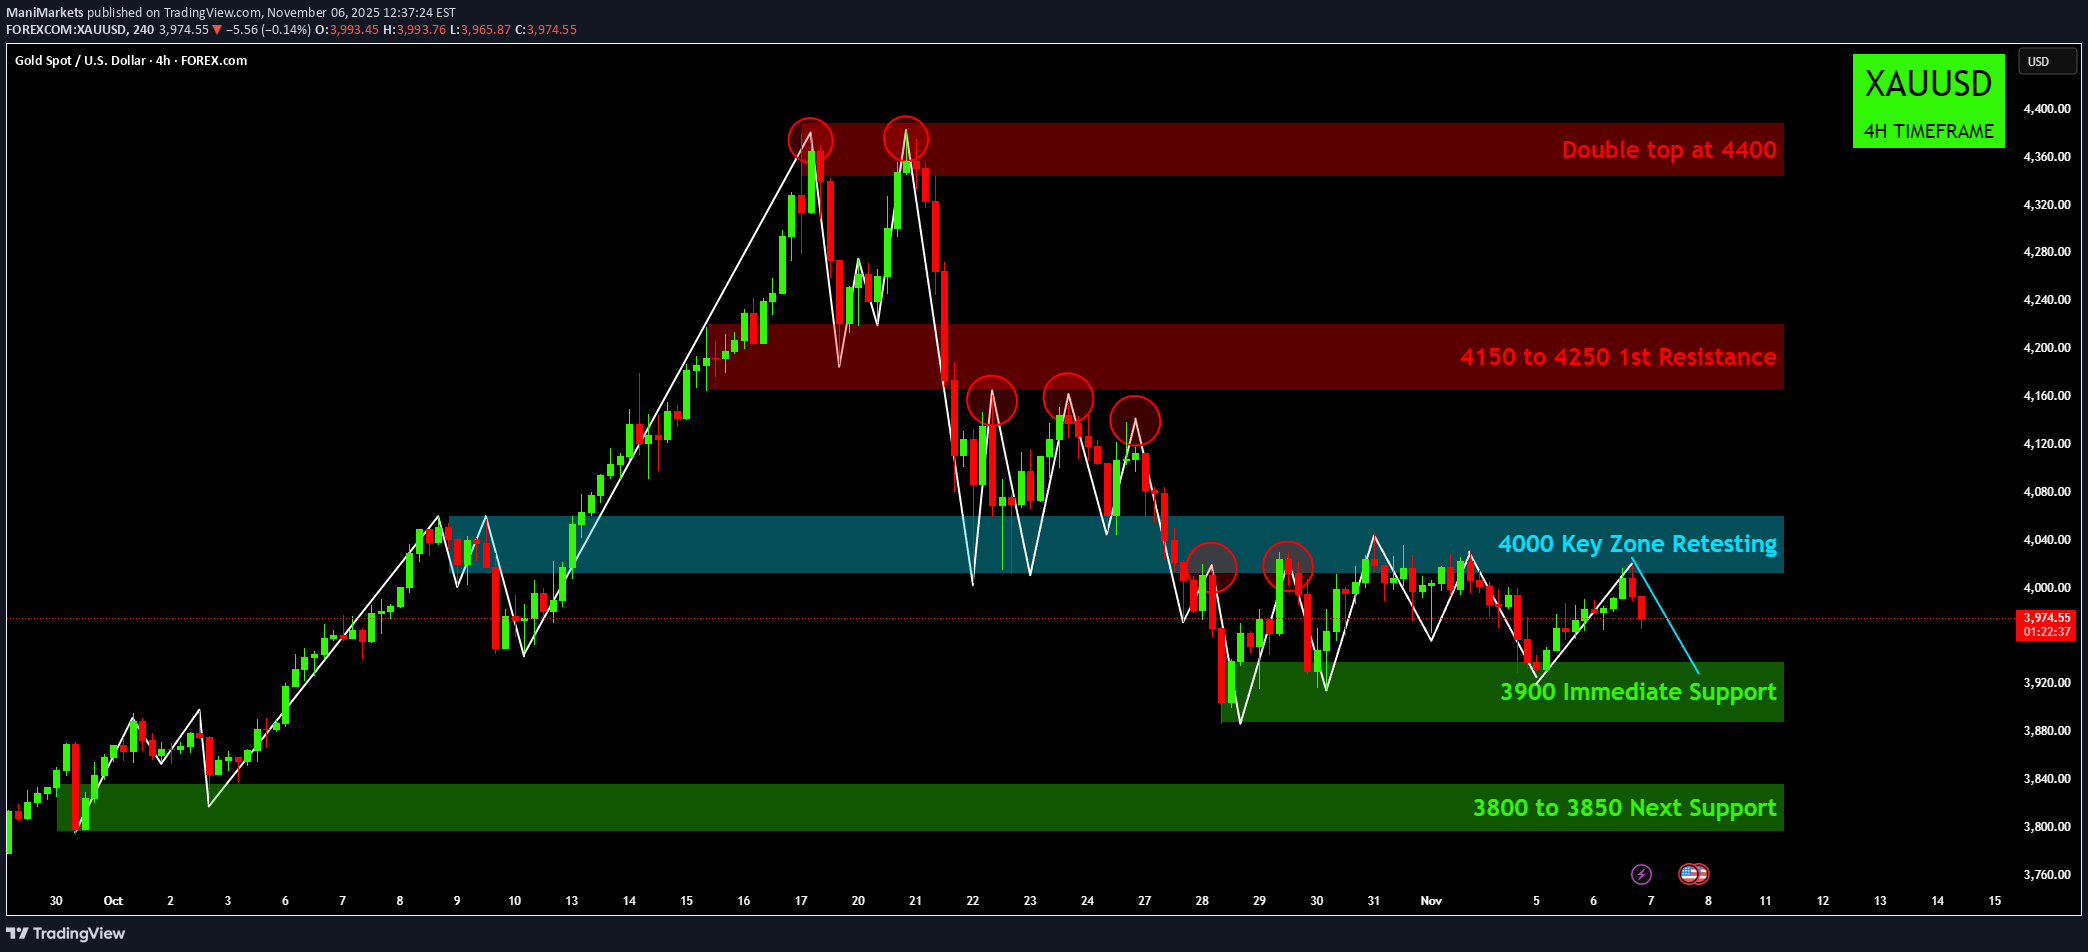
👑 Gold's Critical Crossroads: Double Top Threatens Reversal! 📉 XAU/USD (4H Timeframe) Analysis Gold has experienced a significant uptrend followed by a sharp reversal pattern, leaving traders to navigate a crucial period of consolidation and retesting. The chart highlights key supply and demand zones that will dictate the metal's next major move. 1. The Bearish Setup: Double Top and Key Zone Loss The chart clearly shows that the bullish momentum stalled after hitting a high around 4400. ⚠️ The Double Top at 4400: This major bearish reversal pattern formed, indicating strong selling pressure at the top. The price couldn't sustain the breakout, leading to a swift decline. 📉 Breakdown of the 4000 Key Zone: After the double top, Gold lost the critical 4000 Key Zone, which previously acted as strong support (teal box). The price is now retesting this zone from below, confirming its transition into a resistance area. 🛑 4150 to 4250 (1st Resistance): This large red zone represents the first major overhead supply area. For bulls to regain confidence, they would need to conquer this zone, but it looks heavily defended for now. 2. Current Price Action and Support Levels The price is currently consolidating below the 4000 resistance, forming a classic "descending triangle" or consolidation pattern. 🛡️ 3900 Immediate Support: The price is being held up by the 3900 immediate support level (green box). Holding this level is essential to prevent a further slide. A break below 3900 would likely signal more downside. 🎯 3800 to 3850 Next Support: This deeper green zone is the last line of defense for the current structure. This area aligns with the base of the previous major rally, making it a critical demand zone. 3. Trade Plan Scenarios Bulls (Long): Entry Trigger: A sustained breakout and candle close above the 4000 Key Zone. Target: A retest of the 4150 to 4250 resistance area. Bears (Short): Entry Trigger: A confirmed breakdown and candle close below the 3900 Immediate Support. Target: The next major demand zone at 3800 to 3850. In summary, Gold is at a pivotal point. Traders should monitor the battle at the 3900 support and 4000 resistance for the next directional cue! What do you think will happen next: will Gold hold 3900 or finally break above 4000? Disclaimer: The information provided in this chart is for educational and informational purposes only and should not be considered as investment advice. Trading and investing involve substantial risk and are not suitable for every investor. You should carefully consider your financial situation and consult with a financial advisor before making any investment decisions. The creator of this chart does not guarantee any specific outcome or profit and is not responsible for any losses incurred as a result of using this information. Past performance is not indicative of future results. Use this information at your own risk. This chart has been created for my own improvement in Trading and Investment Analysis. Please do your own analysis before any investments.