Technical analysis by coinpediamarkets about Symbol ONDO on 11/4/2025

تحلیل کامل ONDO/USDT: آیا سقوط تا ۰.۴۵ دلار ادامه دارد؟
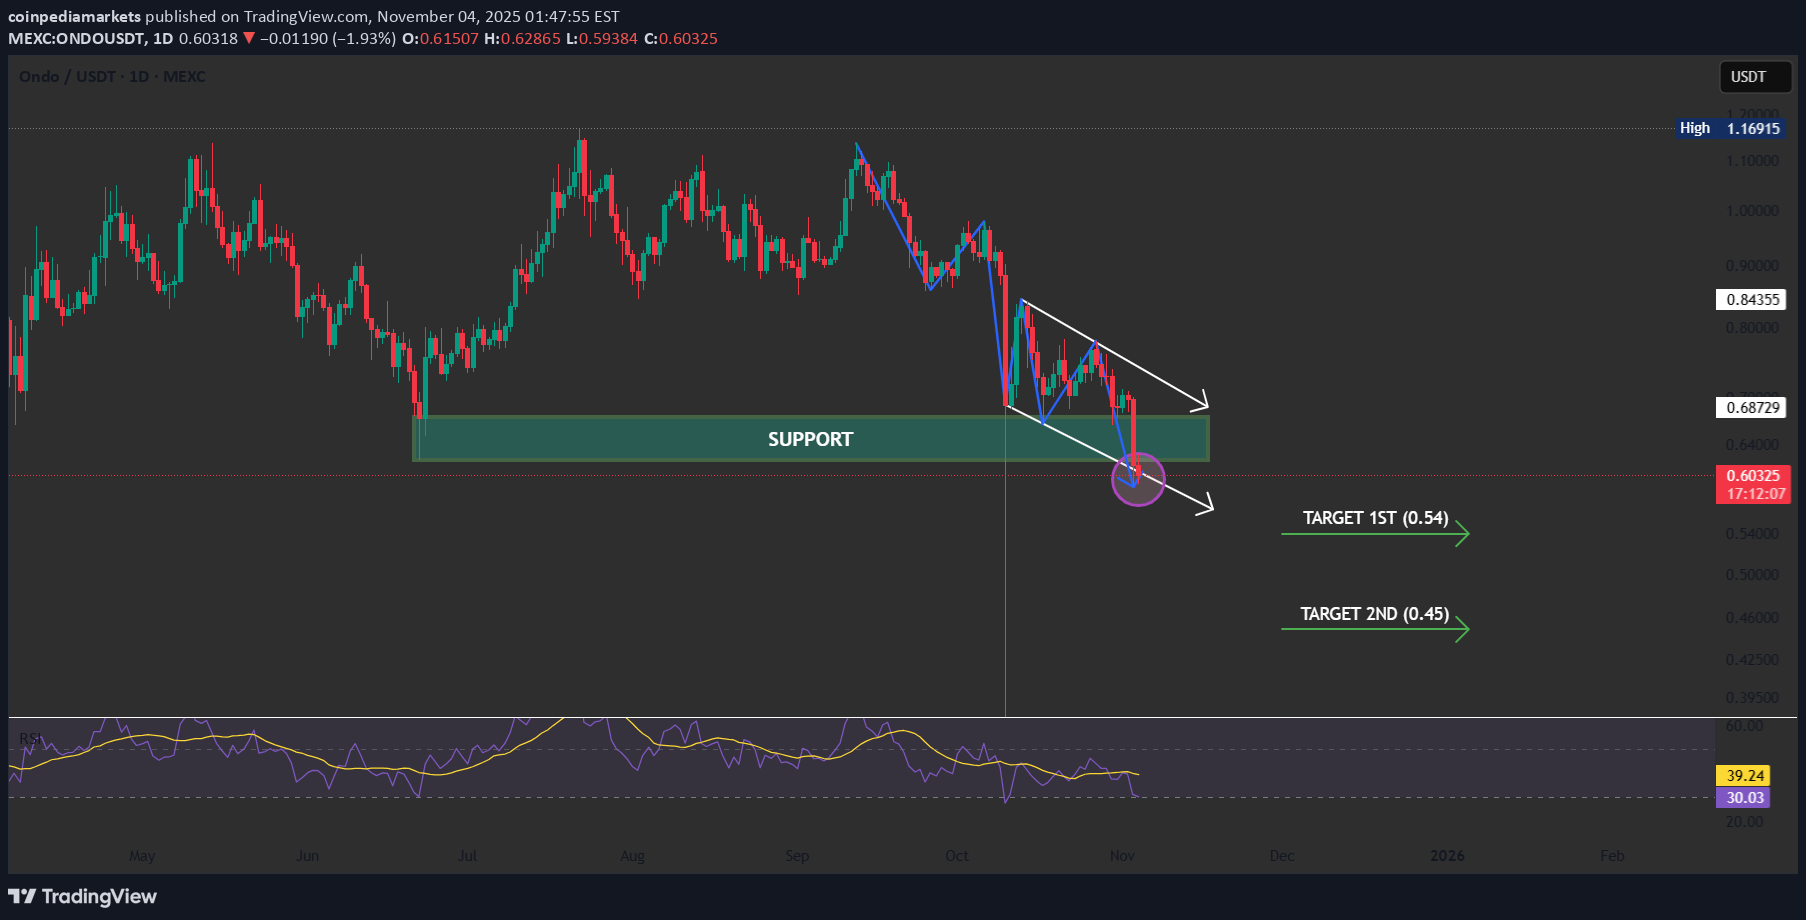
Chart Analysis: ONDO / USDT ONDO/USDT (Chart):- markets.coinpedia.org/ondo-finance/ Pattern: Descending Channel (Falling Wedge Breakdown Risk) The chart shows ONDO trading inside a descending channel, maintaining consistent lower highs and lower lows, signaling continued bearish momentum. The price is currently retesting a major support zone, where buyers are attempting to hold the level. Key Observations Support Zone: Around $0.58 – $0.60, a strong area previously respected by buyers. Resistance Zone: Between $0.66 – $0.68, aligning with the channel’s upper boundary. RSI Oversold: RSI is hovering near 30, indicating the market is oversold but lacking a clear reversal signal yet. Bearish Pressure: Sellers remain dominant as the price struggles to sustain above the support zone. Potential Move If the support zone fails to hold and price breaks below $0.58, ONDO may continue its downward move with targets at: 🎯 Target 1: $0.54 🎯 Target 2: $0.45 Summary: ONDO remains weak within its descending structure. A clear breakout above $0.66 would be needed to shift momentum, otherwise the bearish continuation remains likely.