Technical analysis by Thundercat131 about Symbol SHIB: Buy recommendation (11/3/2025)

Thundercat131
سیگنال طلایی شیبا (SHIB): الگوی تاریخی با نرخ برد 100% تکرار شد!
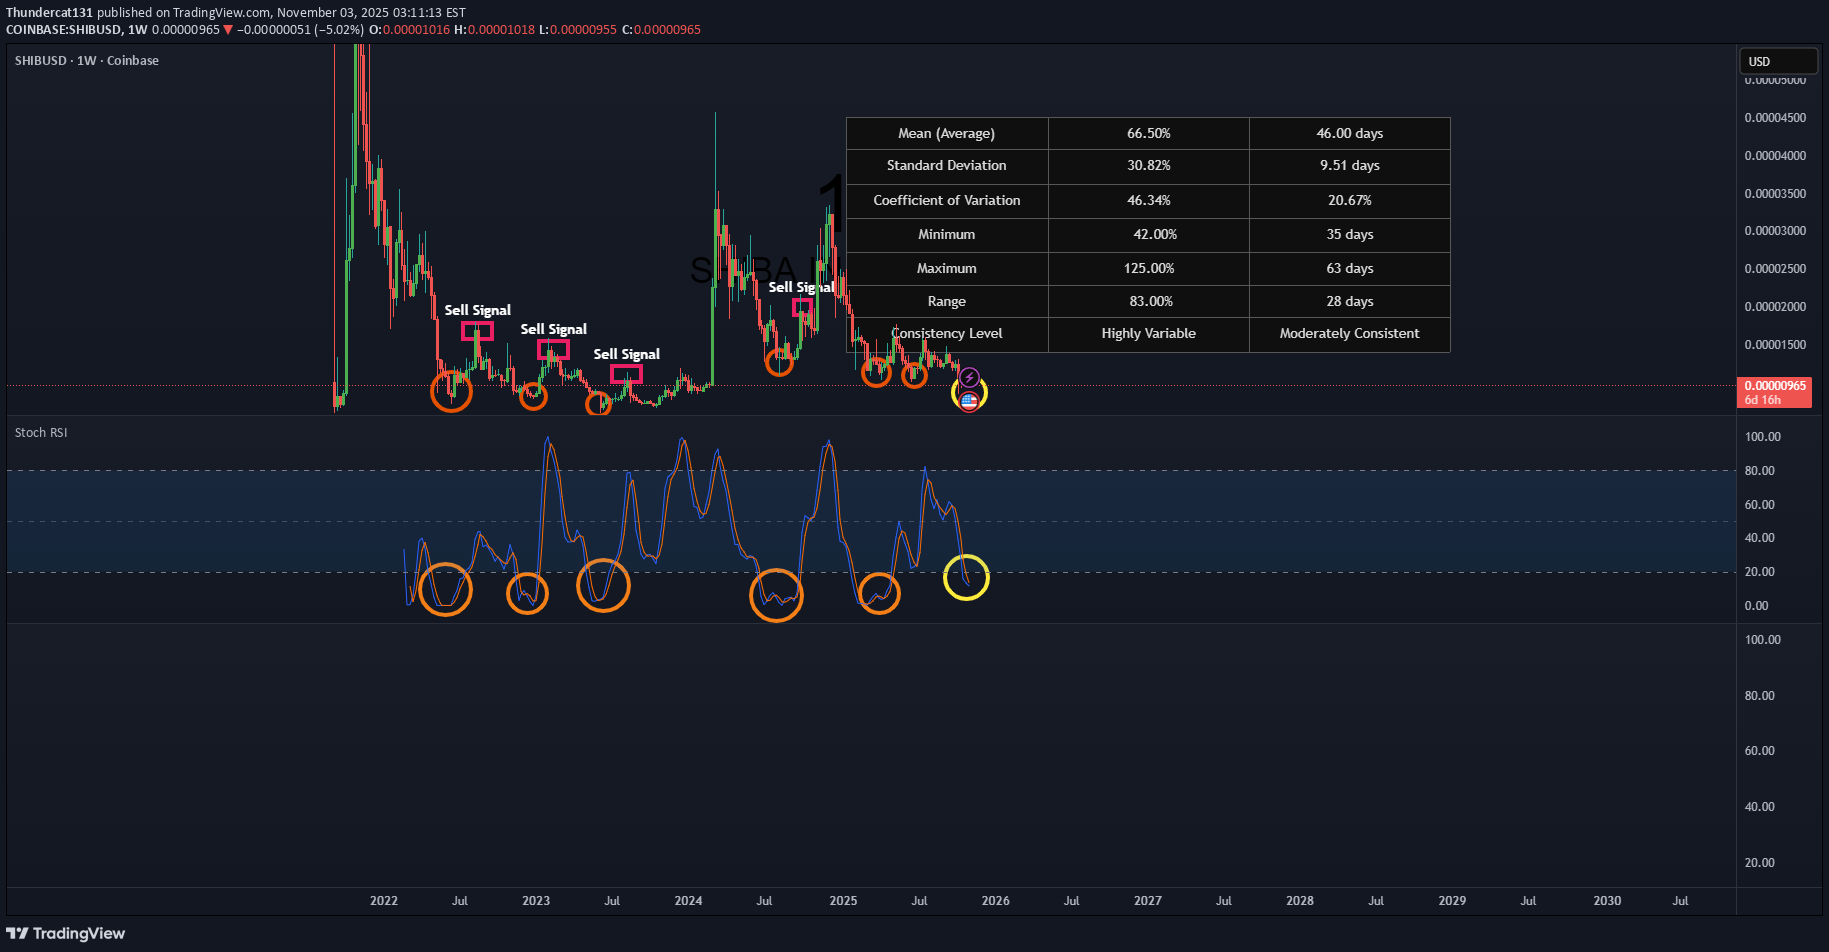
I'm currently observing a potential trading setup in SHIB/USD that mirrors historical patterns we've analyzed. A review of six similar past movements provides us with a data-driven framework for what we might expect. Historical Performance Snapshot: • Back testing Win Rate: 100% (6 out of 6 historical setups resulted in upward moves) • Average Gain: 66.50% • Average Duration: 46 days Key Statistical Insights: • Duration Consistency: The duration of these movements has been moderately consistent, with a standard deviation of just 9.5 days. This suggests a typical timeframe of 36-56 days for a move to play out. • Gain Variability: It is crucial to note that the gains have been highly variable, with a standard deviation of 30.82%. Past movements have ranged from a 42% gain to as high as 125%. Back testing Results: It's worth noting that our back testing of this setup shows a 100% win rate across all six historical instances. Every time this pattern has appeared, it has resulted in an upward move. However, while the direction has been consistent, the magnitude of gains has varied significantly. Interpretation: While the timing of these upward trends has been relatively predictable, the magnitude of the final gain is not. This means that while a move could last approximately a month and a half, the profit potential has a wide range of outcomes. My Approach: Given the high variability in gains, I'll be watching this setup with a focus on risk management. Setting flexible profit targets and a clear invalidation level is key. This is not financial advice, but an observation based on statistical analysis. Please conduct your own research and manage your risk accordingly. I will update once the buy signal is in and then once the closing signal appears. Unfortunately I can not use the other RSI I normally use as its been updated and I am not allowed to upload it due to Trading View rules. The Stochastic RSI is the closest thing I could find to it for now or that allows me to give a visual representation of the trade. Have a blessed week ahead! SHIBUSD SHIBUSDT