Technical analysis by CryptoNuclear about Symbol ETC: Buy recommendation (10/28/2025)

CryptoNuclear
اتریوم کلاسیک (ETC) در آخرین سنگر دفاعی؛ آیا ریزش قطعی است یا خیز بزرگ در راه؟
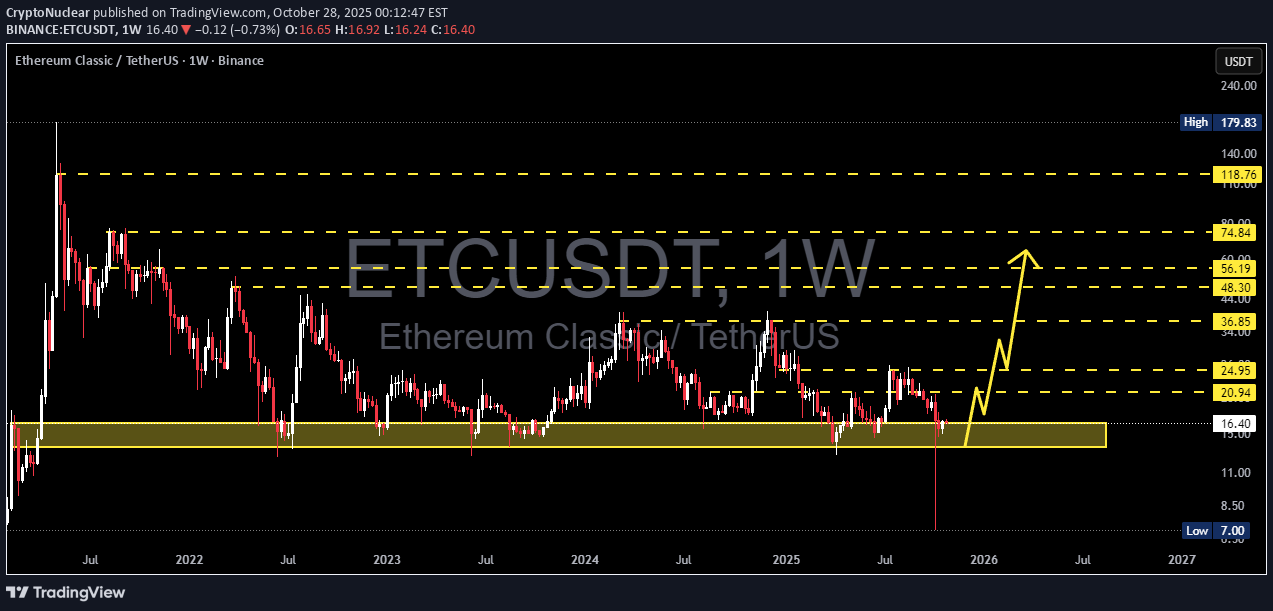
Ethereum Classic (ETC) is once again standing at its final line of defense — the multi-year support zone between 16.40–13.50, which has successfully absorbed selling pressure several times since 2021. This area is not just a price range; it’s a psychological stronghold that separates the potential for a massive rebound from the risk of a full-scale breakdown. For more than three years, ETC has been forming a range-base accumulation structure, where every dip into this zone has triggered strong buying interest. However, each rally has also failed to create higher highs — a clear signal that supply pressure remains dominant in the mid-term structure. At this point, the market is in equilibrium — a tension zone between buyers defending the historical base and sellers pressing for continuation. The next decisive move will be determined right here, inside the yellow block. --- Bullish Scenario — Reclaim and Rally If price holds above 16.40 and manages to close a weekly candle above 20.94 with strong buying volume, ETC could begin a structural reversal toward 24.95 and 36.85. Such a move would confirm that the capitulation phase has ended and that a new accumulation cycle is underway. Key confirmations: Weekly close above 20.94 Higher low formed above 16.4 Rising weekly volume Upside targets: 24.95 → 36.85 → 48.30 --- Bearish Scenario — Breakdown of the Base Failure to defend the zone, especially with a weekly close below 13.50, would confirm a breakdown of the multi-year base. This could trigger a new distribution phase, with potential downside targets at 11.00, 8.00, and possibly a wick toward 7.00 as liquidity gets swept. Key confirmations: Weekly close below 13.50 Failed retest (support turns to resistance) Increasing sell volume Downside targets: 11.20 → 8.00 → potential liquidity sweep near 7.00 --- Pattern Structure Range Base Accumulation: multi-year accumulation between 13–36 since 2021. Descending Structure: a series of lower highs, showing continuous supply pressure. Liquidity Sweep: a deep wick to the 7.0 area indicates previous stop-hunts and possible smart-money accumulation. Decision Point: 16.4–13.5 remains the make-or-break level that will define ETC’s long-term direction. --- Conclusion ETC is at a major decision point after years of sideways consolidation. If the support holds, the asset could trigger a macro reversal and join the next major crypto bull cycle. But if it breaks down, the fall could be steep — as liquidity below this zone is thin. The 16.4–13.5 zone is the last line between hope and capitulation. Watch the weekly close — that’s where the next big move will be decided. --- #ETC #ETCUSDT #EthereumClassic #CryptoAnalysis #SwingTrading #TechnicalAnalysis #SupportResistance #WeeklyChart #CryptoBreakout #MarketStructure