Technical analysis by CryptoNuclear about Symbol INJ: Buy recommendation (10/26/2025)

CryptoNuclear
نقطه حیاتی اینجکتیو (INJ): آیا این حمایت افسانهای دوام میآورد؟
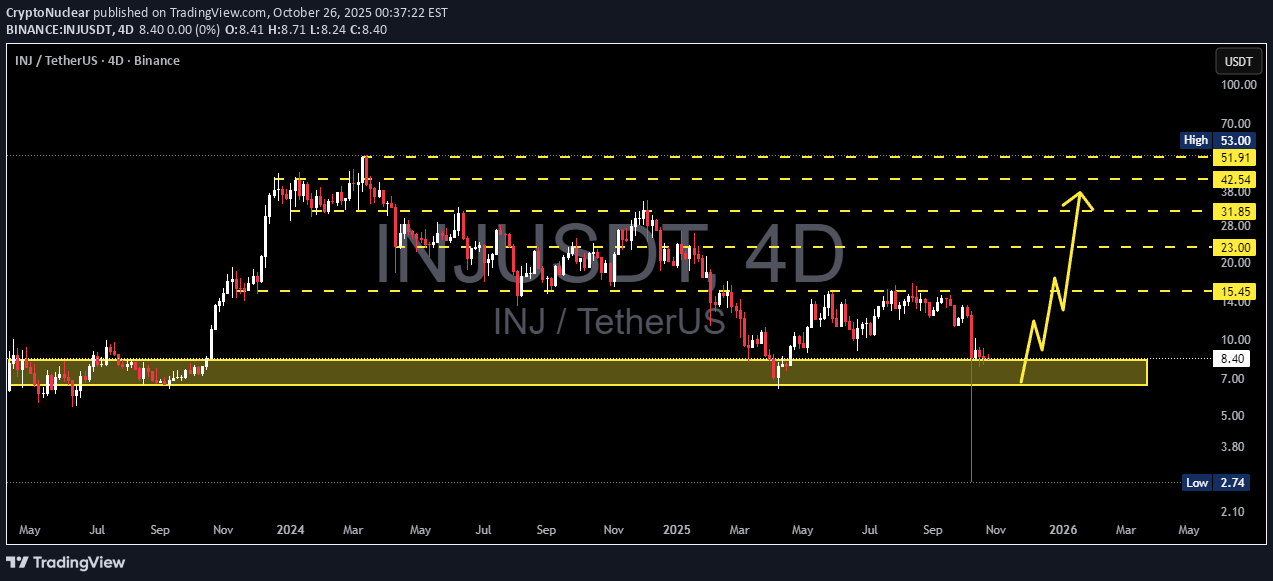
INJ is standing at its most crucial turning point since 2023, once again testing the legendary support zone between $6.5–$8.3 — the same area that previously sparked one of its most explosive rallies all the way up to $53. This yellow block on the chart isn’t just an ordinary support; it represents the last stronghold of the bulls — the place where the market once flipped from distribution to euphoria. Now, that fortress is being tested again under relentless bearish pressure since mid-2024. --- 📉 Technical Structure: Primary Trend: Still in a medium-term downtrend (series of lower highs and lower lows). Key Support Zone (Demand Area): $6.5 – $8.3 Major Resistances: $15.45 → $23.00 → $31.85 → $42.54 → $51.91 Historical Low: $2.74 A long downside wick observed earlier signals extreme liquidity events — likely the result of large-scale stop-hunting or a capitulation flush. Yet, the quick candle recovery indicates that buyers are still defending below this area. --- 📈 Bullish Scenario: If price manages to hold above the yellow zone and prints a bullish engulfing candle on the 4D timeframe with rising volume, a strong rebound could emerge. The first upside target would be $15.45, and if momentum builds alongside a forming higher-low structure, the market could extend toward the $23.00–$31.85 range to confirm a medium-term trend reversal. A clean breakout and close above $23.00 would confirm a major trend reversal, potentially reopening the path to retest the higher supply zones between $42–$51. --- 📉 Bearish Scenario: However, if INJ fails to hold above $6.5 and confirms a 4D candle close below the yellow support zone, the market could enter another distribution phase. Downside targets would then be $3.80, followed by the historical low at $2.74, which may act as the final liquidity magnet. A confirmed breakdown below this support would reinforce seller dominance and likely extend the ongoing downtrend into deeper price territory. --- 📊 Summary: The yellow zone on this chart is INJ’s “make-or-break” fortress. If it holds, the market could witness the beginning of a new accumulation phase before a potential breakout. But if this wall collapses, the chart could rewrite its story toward deeper single-digit levels. Either way, this zone represents the highest confluence of risk and opportunity — the decisive battleground that will shape INJ’s next major trend. --- 🧭 Trading Notes: Conservative traders: Wait for a confirmed 4D close above the yellow zone before entering long positions. Aggressive traders: Consider scaling into positions within the zone with a stop loss below $6.5. Short-sellers: Watch for rejections around $15.45 — a failed breakout there could offer swing short opportunities back toward the $8 region. Risk management remains key — never let emotion override structure. --- #INJ #Injective #INJUSDT #CryptoAnalysis #TechnicalAnalysis #PriceAction #SupportZone #SwingTrade #CryptoMarket #MarketStructure #TrendAnalysis #BullishVsBearish