Technical analysis by sunya about Symbol PAXG on 10/25/2025

sunya
پیشبینی هفتگی طلا (XAUUSD): نبرد بزرگ گاوها و خرسها و سطوح کلیدی ورود
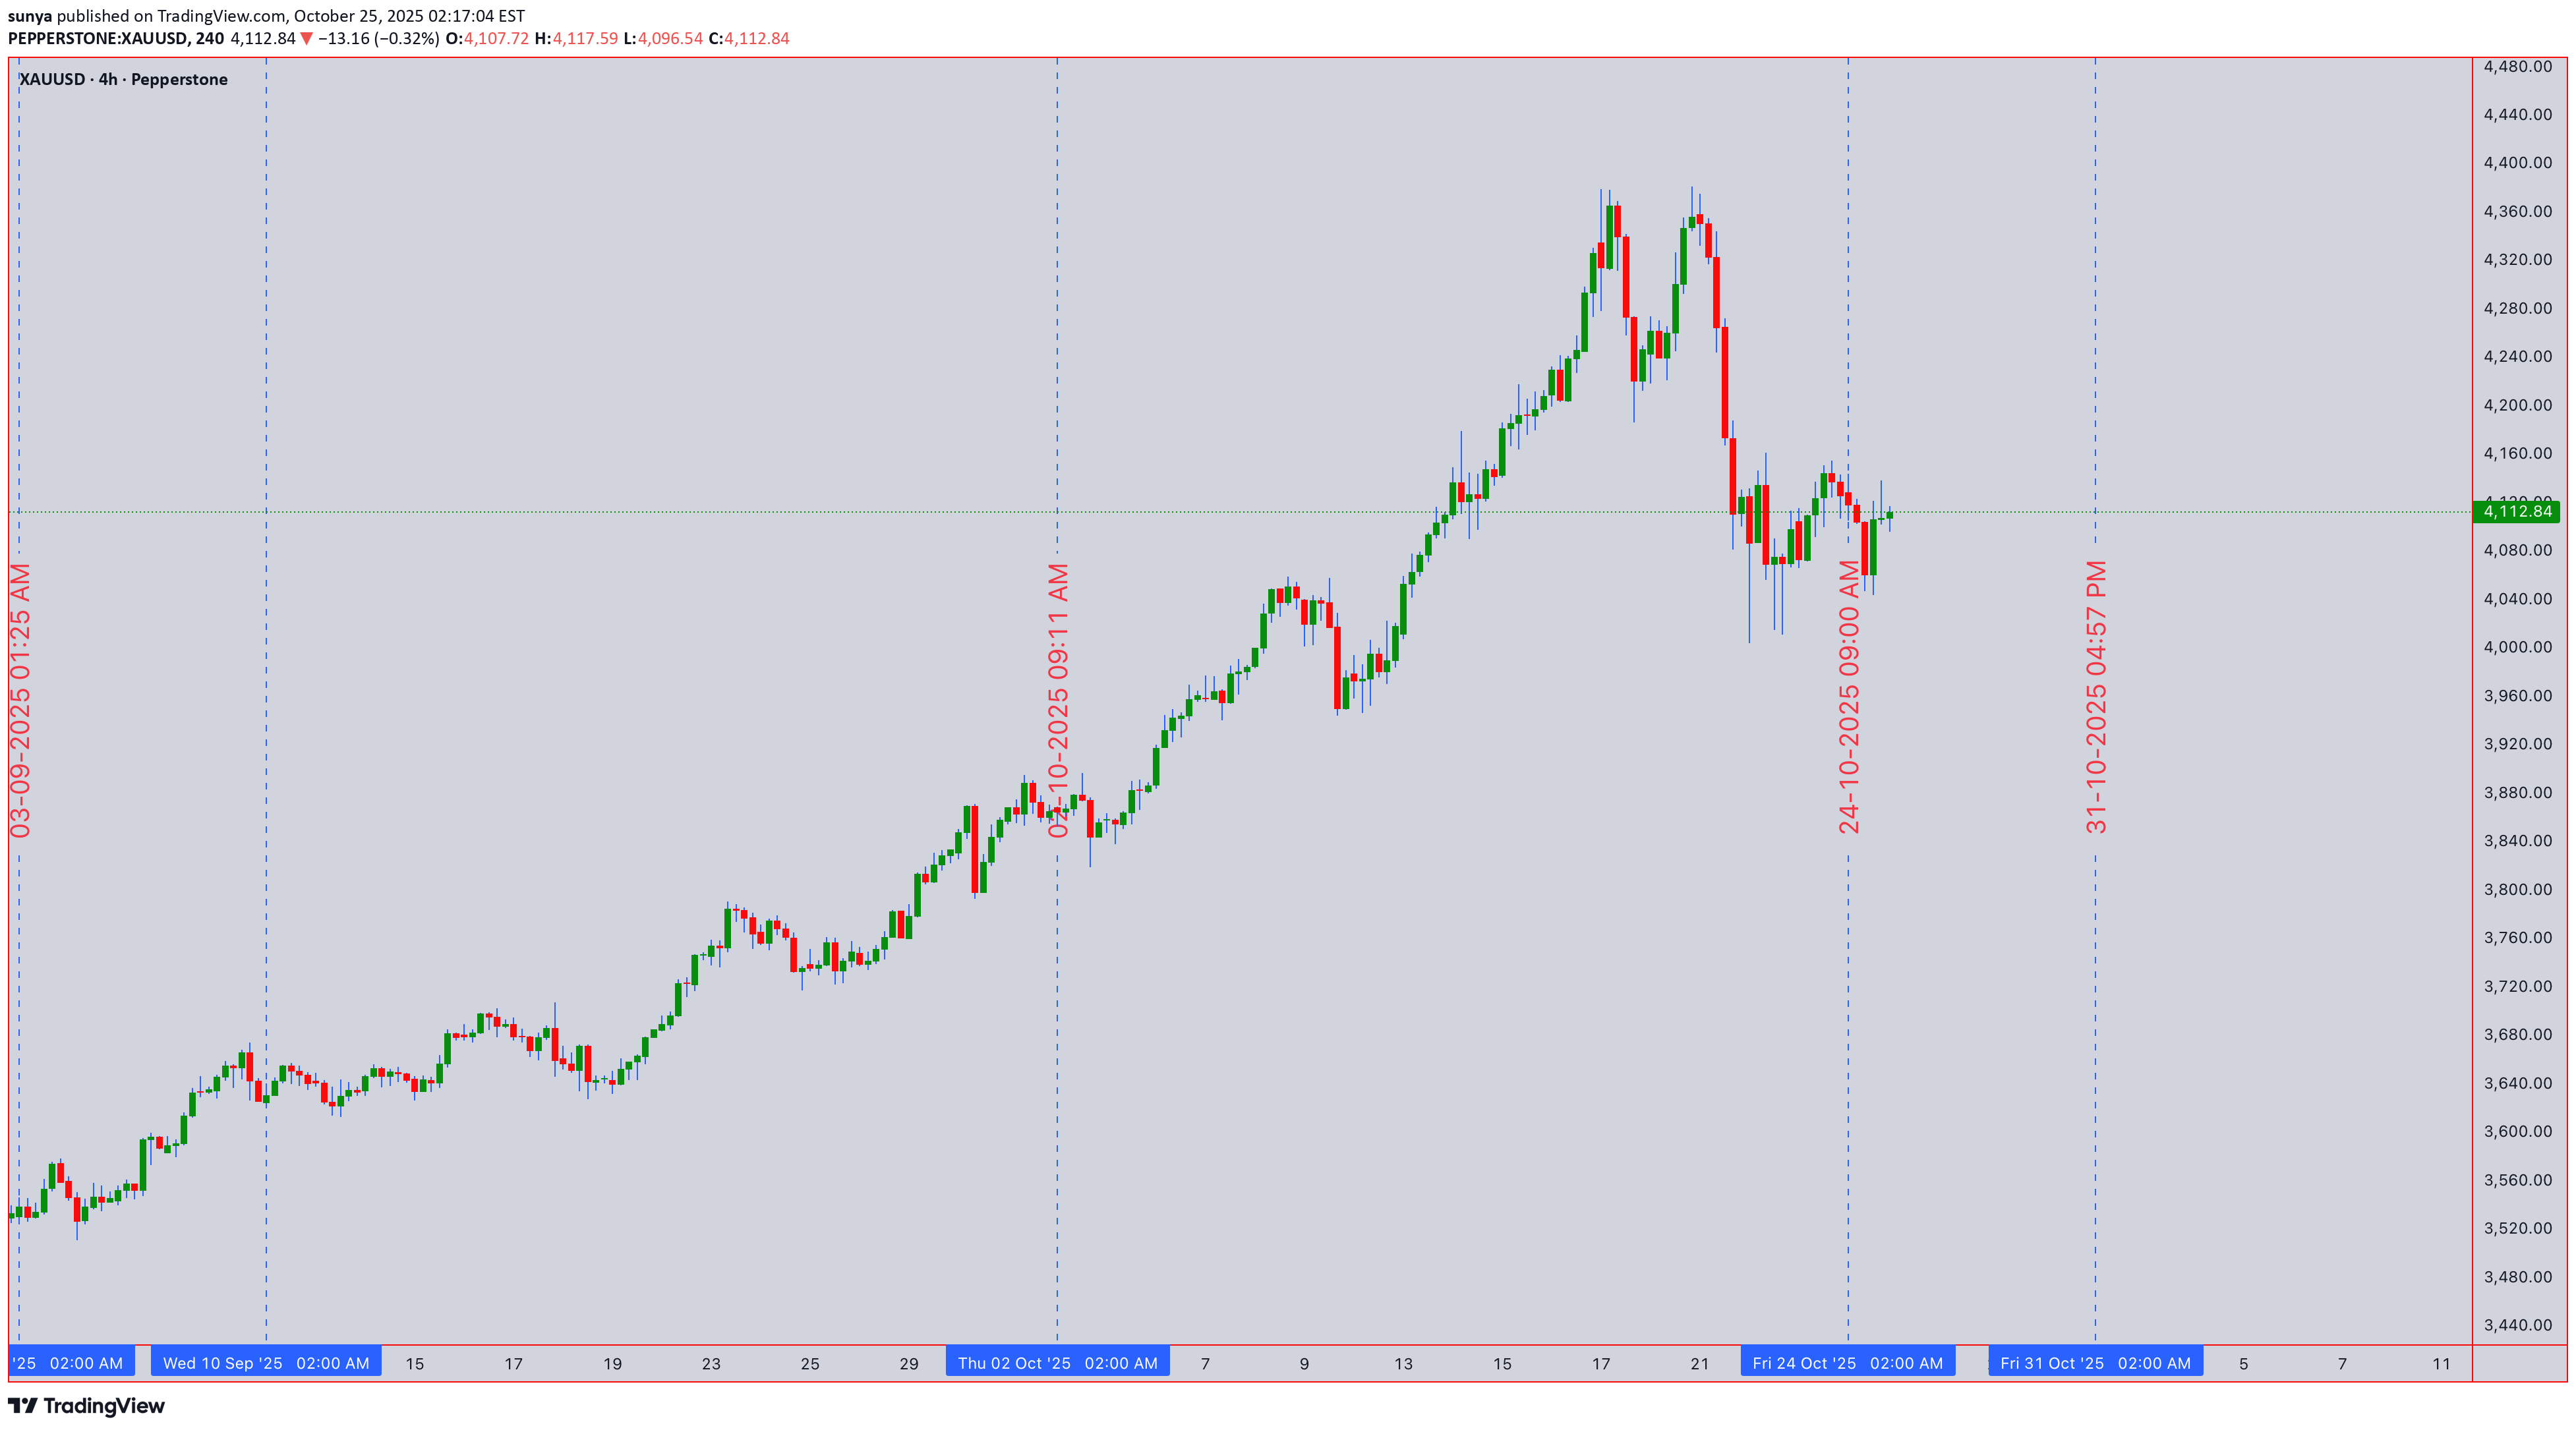
Traders, gear up for a pivotal week in Gold! As of the close at 4,112.84 on Oct 25th , XAUUSD is at a critical juncture. This analysis blends classic theory with modern indicators for intraday swings and positional trades. Bulls and bears are in a fierce battle ⚔️. The stage is set for a significant volatility expansion. The key is to identify the dominant auction. 🎯 1D & 4H: The Swing Trade Panorama (Swing Bias) The higher frames dictate the primary trend. The 1D chart shows a potential completion of an Elliott Wave corrective pattern (ABC) , suggesting a new impulsive wave up may be imminent. Dow Theory : Higher highs & higher lows remain intact on the 1D, confirming the primary uptrend. ✅ Wyckoff Theory : We appear to be in a 'Spring' or 'Sign of Strength' phase after a re-accumulation period around the 4,080-4,100 zone. Ichimoku Cloud : Price is trading above the Kumo (cloud) on 1D, a bullish bias. The Tenkan-sen (blue line) is a key dynamic support. Key S&R : Major support rests at 4,080 (previous resistance, 50 EMA). Resistance is at the recent high of 4,140 . A decisive 4H close above 4,130 could trigger a Bullish Breakout 🚀 targeting 4,180-4,200. Conversely, a break below 4,080 on high volume could see a drop to 4,040. ⏰ Intraday Focus: 1H, 30M, 15M, 5M (Intraday Bias) For intraday action, lower timeframes offer precision entries. Harmonic & Gann Theory : A clear Bullish Bat Pattern has potentially completed on the 1H chart. The PRZ (Potential Reversal Zone) aligns perfectly with the 4,100-4,105 support. Gann's 50% retracement level from the last swing up also converges here. Bollinger Bands (20,2) : On the 1H/4H, price is hugging the upper band, indicating strong momentum. A squeeze on the 30M chart suggests a volatility expansion is due. RSI (14) : On the 1H, RSI is in the 55-60 range, showing healthy momentum without being overbought. Watch for bearish divergence on a new high as a reversal signal. VWAP & EMA Confluence : The 20 and 50 EMAs are providing dynamic support on pullbacks. For day trades, the VWAP on the 15M/5M charts will be your best friend for trend alignment. Long above, short below. 🚦Trade Plan: Entries, Exits & Risk Management Identifying reversals is key. Use Japanese Candlesticks at key S&R levels. A bullish engulfing or morning star pattern at the 4,100 support, confirmed by a rising volume spike, is a high-probability long signal. Swing Long Entry : On a 4H close > 4,130, or a pullback to 4,100-4,105 with bullish confirmation. Swing Short Entry : On a 1D close < 4,080, targeting 4,040. Intraday Long : Buy on a bounce from VWAP/20 EMA on the 15M chart with RSI > 50. Intraday Short : Sell on a rejection from the 4,125-4,130 resistance with a bearish RSI divergence. Stop-Loss : Always 15-20 pips below/above your entry trigger candle. 💡The Bottom Line: The bullish structure is favored as long as 4,080 holds. The confluence of Harmonic patterns, Wyckoff accumulation, and bullish Ichimoku alignment points to a potential leg higher. However, respect the levels. A break below support will invalidate the bullish thesis. Track these charts live: 1D: 4H: 1H: 30M: 15M: 5M: ⚠️ Disclaimer: This post is educational content and does not constitute investment advice, financial advice, or trading recommendations. The views expressed here are based on technical analysis and are shared solely for informational purposes. The stock market is subject to risks, including capital loss, and readers should exercise due diligence before investing. We do not take responsibility for decisions made based on this content. Consult a certified financial advisor for personalized guidance.