Technical analysis by BullBearInsights about Symbol AMZNX on 10/23/2025

BullBearInsights
آمازون (AMZN): آیا شکست ۲۲۳ دلار، جهش تا ۲۲۷ دلار را در روز جمعه کلید میزند؟
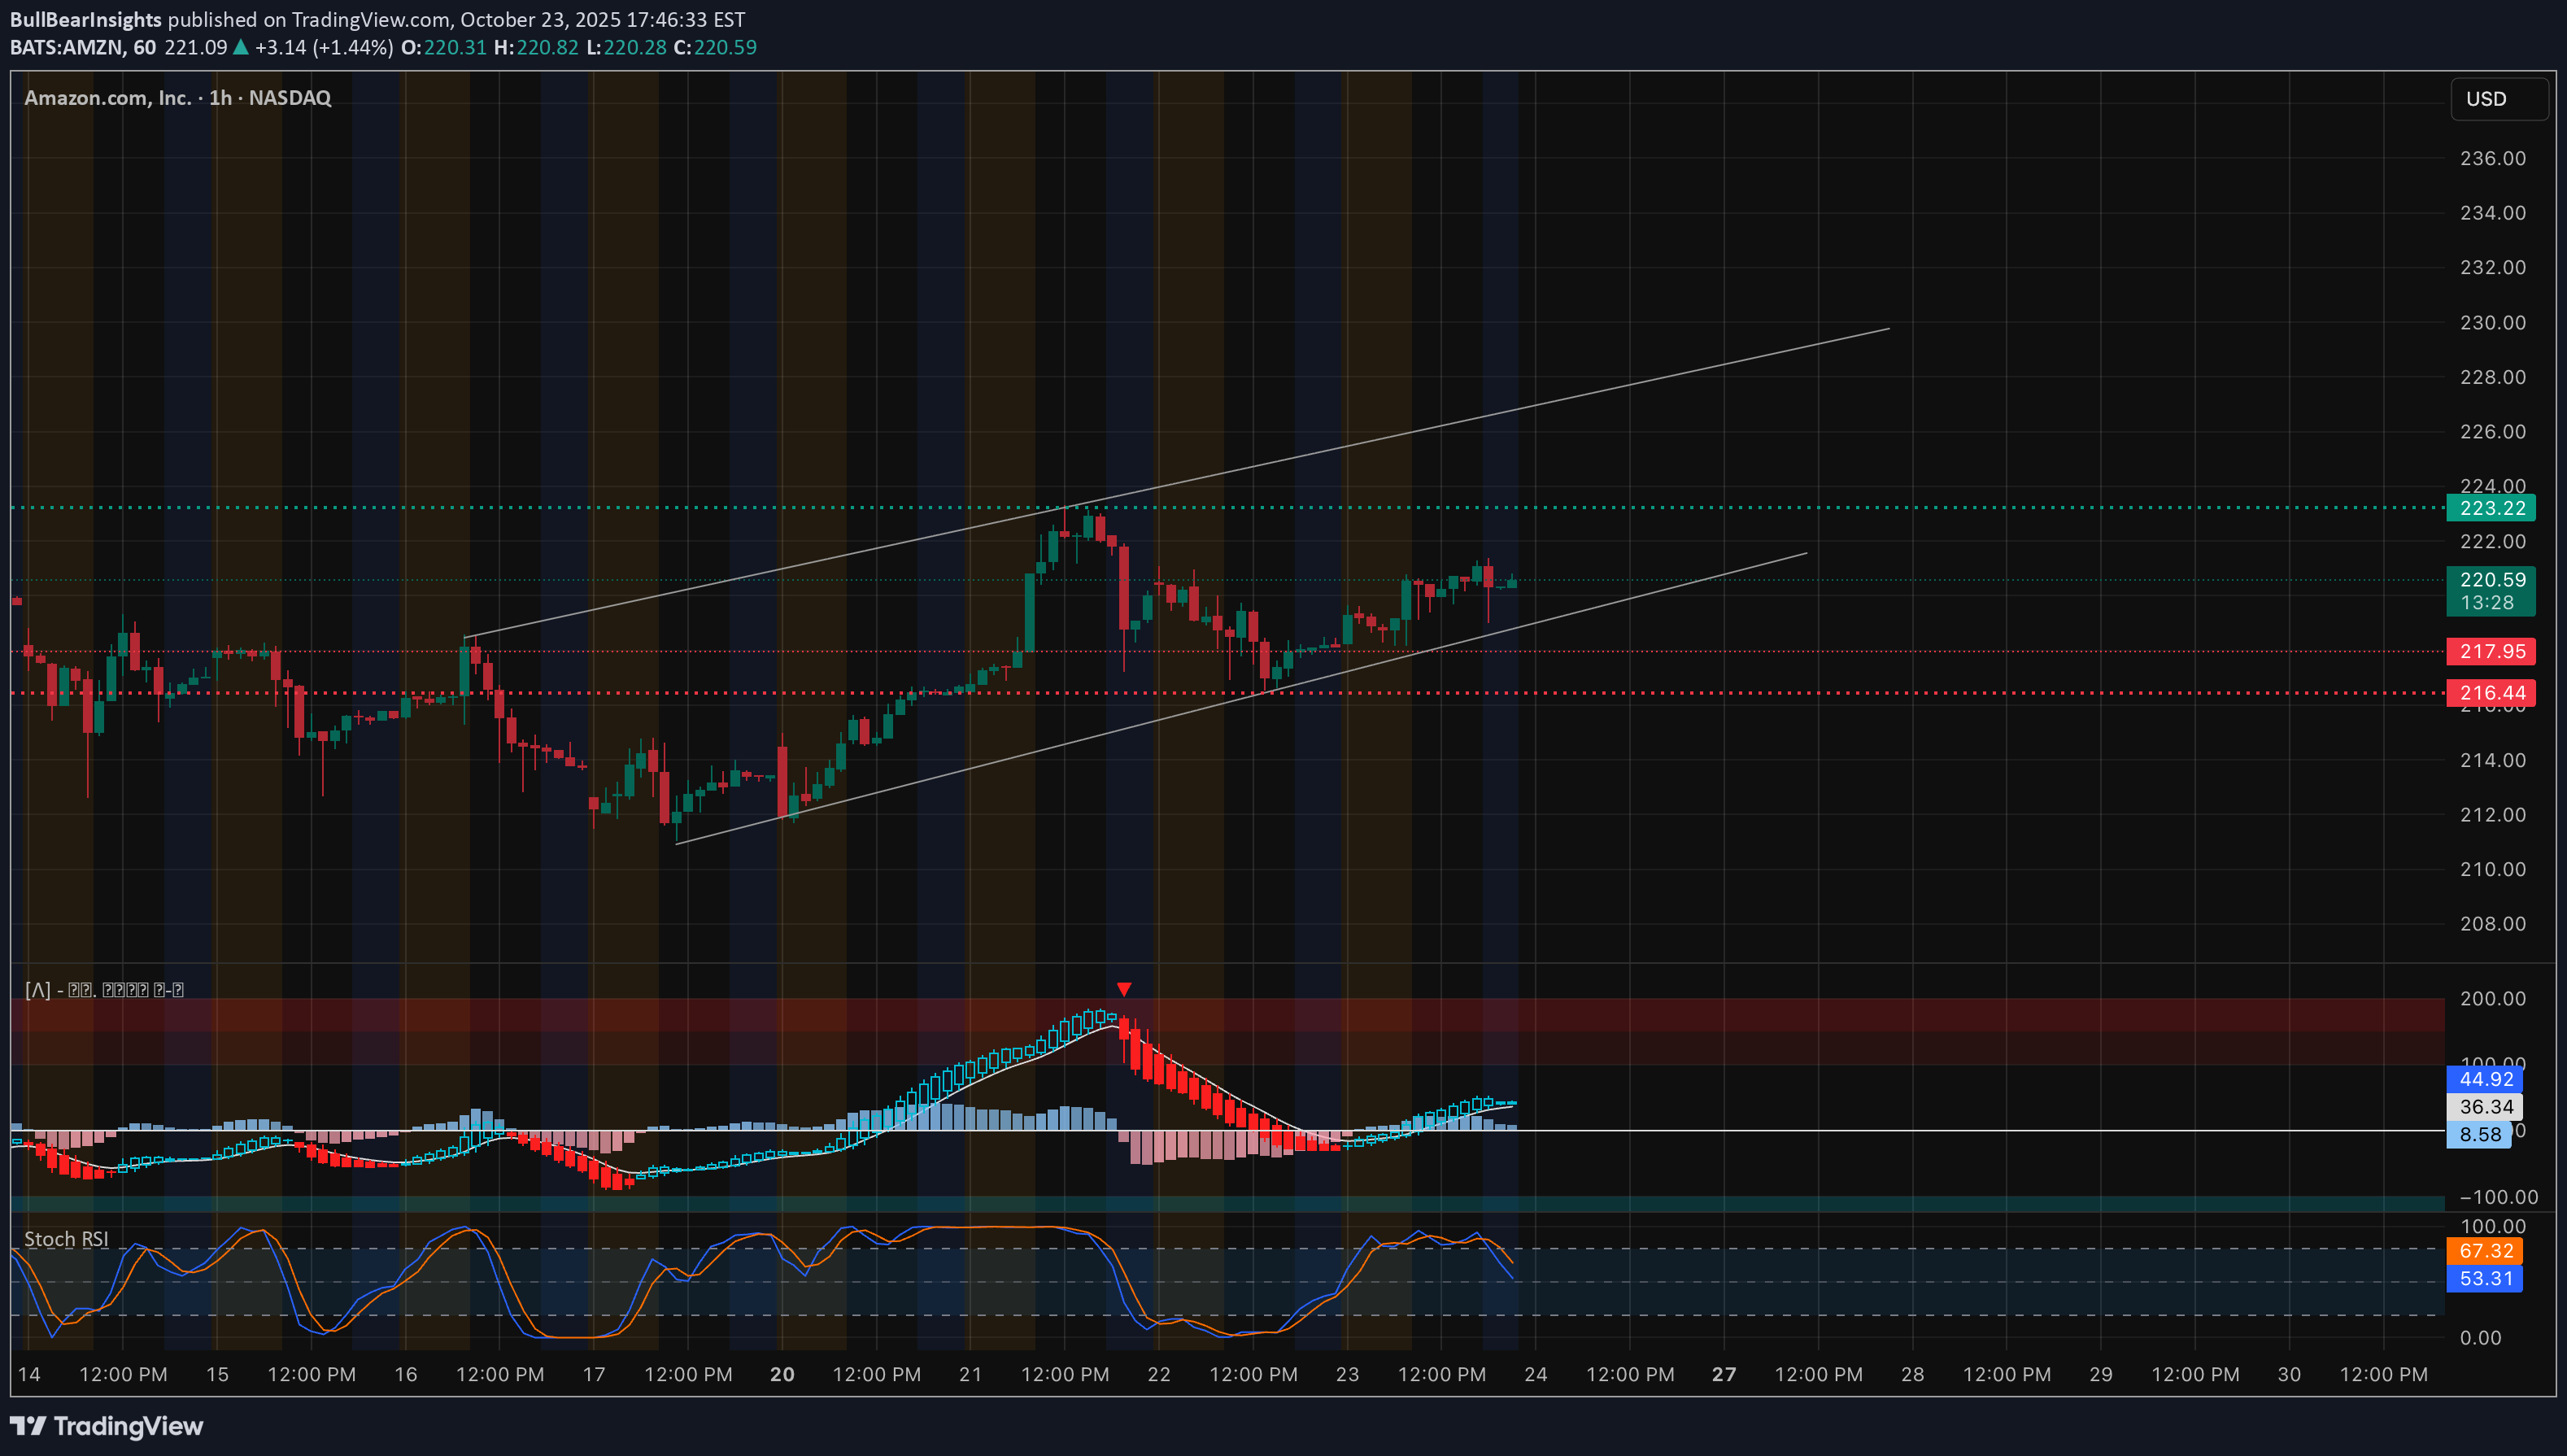
Will $223 Breakout Trigger a Squeeze Toward $227? 📦 1. Market Structure (1H & 15M) Amazon’s current market structure shows controlled bullish accumulation following a textbook CHoCH-BOS rotation from the $215–$217 demand base. On the 1-hour chart, AMZN reclaimed structure with a decisive Break of Structure (BOS) near $220, confirming higher-timeframe buyers stepping in. Price remains inside a clean ascending channel, indicating continuation as long as the lower trendline (around $217.5) holds. The 15-minute chart further refines this structure: multiple BOS and CHoCH sequences show smart money defending liquidity each time price dips under $218. Recent intraday CHoCHs appear as normal retests within a broader bullish framework — not full reversals yet. Momentum is consolidating right beneath short-term resistance at $223, suggesting the market is coiling for a potential Friday breakout. 2. Supply and Demand / Order Blocks * Demand Zone (High Confluence): $215–$217. This aligns with previous BOS zones and serves as a high-volume reaccumulation pocket. Expect responsive buyers on any intraday flush into this level. * Immediate Support: $218–$219 (fair value gap + EMA confluence). If price holds here overnight, it strengthens the bullish case. * Supply Zone (Key Liquidity Cluster): $223–$226 — heavy liquidity and prior distribution level where sellers could initially react. A break and close above $223.5 could open the door to a squeeze toward $227–$230. 3. Indicator Confluence * 9 EMA / 21 EMA: Both EMAs have maintained bullish alignment on the 15-minute and 1-hour charts. The slope remains positive, indicating strong momentum with short-term pullbacks being bought. * MACD: On the 1-hour, MACD is regaining momentum after a brief reset — histogram turning green again, suggesting the next impulse wave could start soon. The 15-minute MACD shows flattening, meaning a buildup of energy before the next move. * RSI: 1-hour RSI sits near 67, consistent with bullish control but not overextended. The 15M RSI oscillates around 55–60 — a healthy reset zone before a possible expansion move. * Volume: Stable, with stronger inflow during the breakout above $218 and tapering during sideways consolidation — classic continuation behavior. 4. GEX (Gamma Exposure) & Options Sentiment Friday’s GEX chart reveals $223–$225 as the highest positive gamma zone, marking the near-term resistance ceiling. The HVL (High Volume Level) support sits around $212.5, perfectly aligned with the lower demand range. Below that, the PUT wall at $210 is a key defensive line for bulls, while above, the CALL walls cluster around $223 and $227, suggesting limited overhead resistance once $223 is cleared. With IVR at 37.3 and IVX avg at 44.5 (-4.28%), implied volatility is cooling off, often preceding price expansion. The options flow leans 46% toward calls, confirming growing bullish sentiment without extremes — the ideal conditions for a controlled breakout move. Dealers remain net positive gamma around $220, meaning price action should remain stable until it breaches that $223–$225 zone, where hedging flows could accelerate upside momentum into $227+. 5. Trade Scenarios for Friday, Oct. 24 Bullish Setup 🟩 * Entry Zone: $218–$219 on intraday retest or breakout above $223.3 * Targets: $225 → $227 → $230 * Stop-Loss: Below $217.5 * Confirmation: Hold above 9 EMA on 15M, MACD histogram green, RSI > 60 Bearish Setup 🟥 * Entry Zone: $223–$225 rejection area * Targets: $219 → $216 → $212 * Stop-Loss: Above $226 * Confirmation: MACD crossdown on 15M + CHoCH below $218 with volume 6. Closing Outlook for Oct. 24 (Friday) Friday sets up as a momentum continuation day for AMZN — the structure is bullish, EMAs aligned, and gamma positioning supports a controlled grind higher unless $217 breaks. If buyers defend $218 overnight and premarket dips get absorbed, the stage is set for a break-and-run above $223, potentially triggering dealer hedging and a squeeze into $227+. However, if price fails to reclaim $223 or shows clear rejection with declining volume, expect a controlled drift back toward $215–$217 before buyers attempt again next week. My take: AMZN looks technically strong and primed for follow-through, but $223 remains the gatekeeper. Momentum is building quietly — if the wall breaks, expect quick movement and thin resistance above. 💬 Final Thought: “AMZN’s structure looks tight and ready. If $223 snaps, watch it glide through $227 fast — if not, $217 reload zone will likely be retested before the next push.” This analysis is for educational purposes only and not financial advice. Always do your own research and manage your risk before trading.Intraday Structure Update (Oct 24) Price continues to respect the ascending channel, showing a strong structure with multiple validated touches on both the upper and lower bounds. After the recent CHoCH → BOS sequence, buyers have regained short-term control. Current Price Action * Price: $224.60 area * Structure: Bullish continuation within the intraday channel * Recent Move: A confirmed Break of Structure (BOS) near $224 suggests continuation as long as the channel’s midline holds. * CHoCH Zone: Around $223.2–$223.4 (acts as demand base now). * MACD: Starting to curl back up from equilibrium, showing early signs of renewed momentum. * Stochastic RSI: Turning upward from mid-levels, suggesting possible intraday continuation if momentum builds. Levels to Watch * Resistance: $225.00 → $226.00 zone (upper channel target). * Support: $223.00 → $222.80 (must hold for bullish structure to stay intact). * Breakdown Risk: Below $222.5 could trigger a quick drop toward $221.1. As long as it stays above the lower trendline (~$223) and maintains higher lows, the bias remains bullish within the channel. Watch for a possible breakout attempt toward $226 if volume increases. If momentum fades, expect consolidation or a light retracement back to the midline before continuation.