Technical analysis by BullBearInsights about Symbol NVDAX on 10/23/2025

BullBearInsights
انویدیا (NVDA) در آستانه انفجار: آیا قیمت به ۱۸۵ دلار میرسد یا سقوط میکند؟
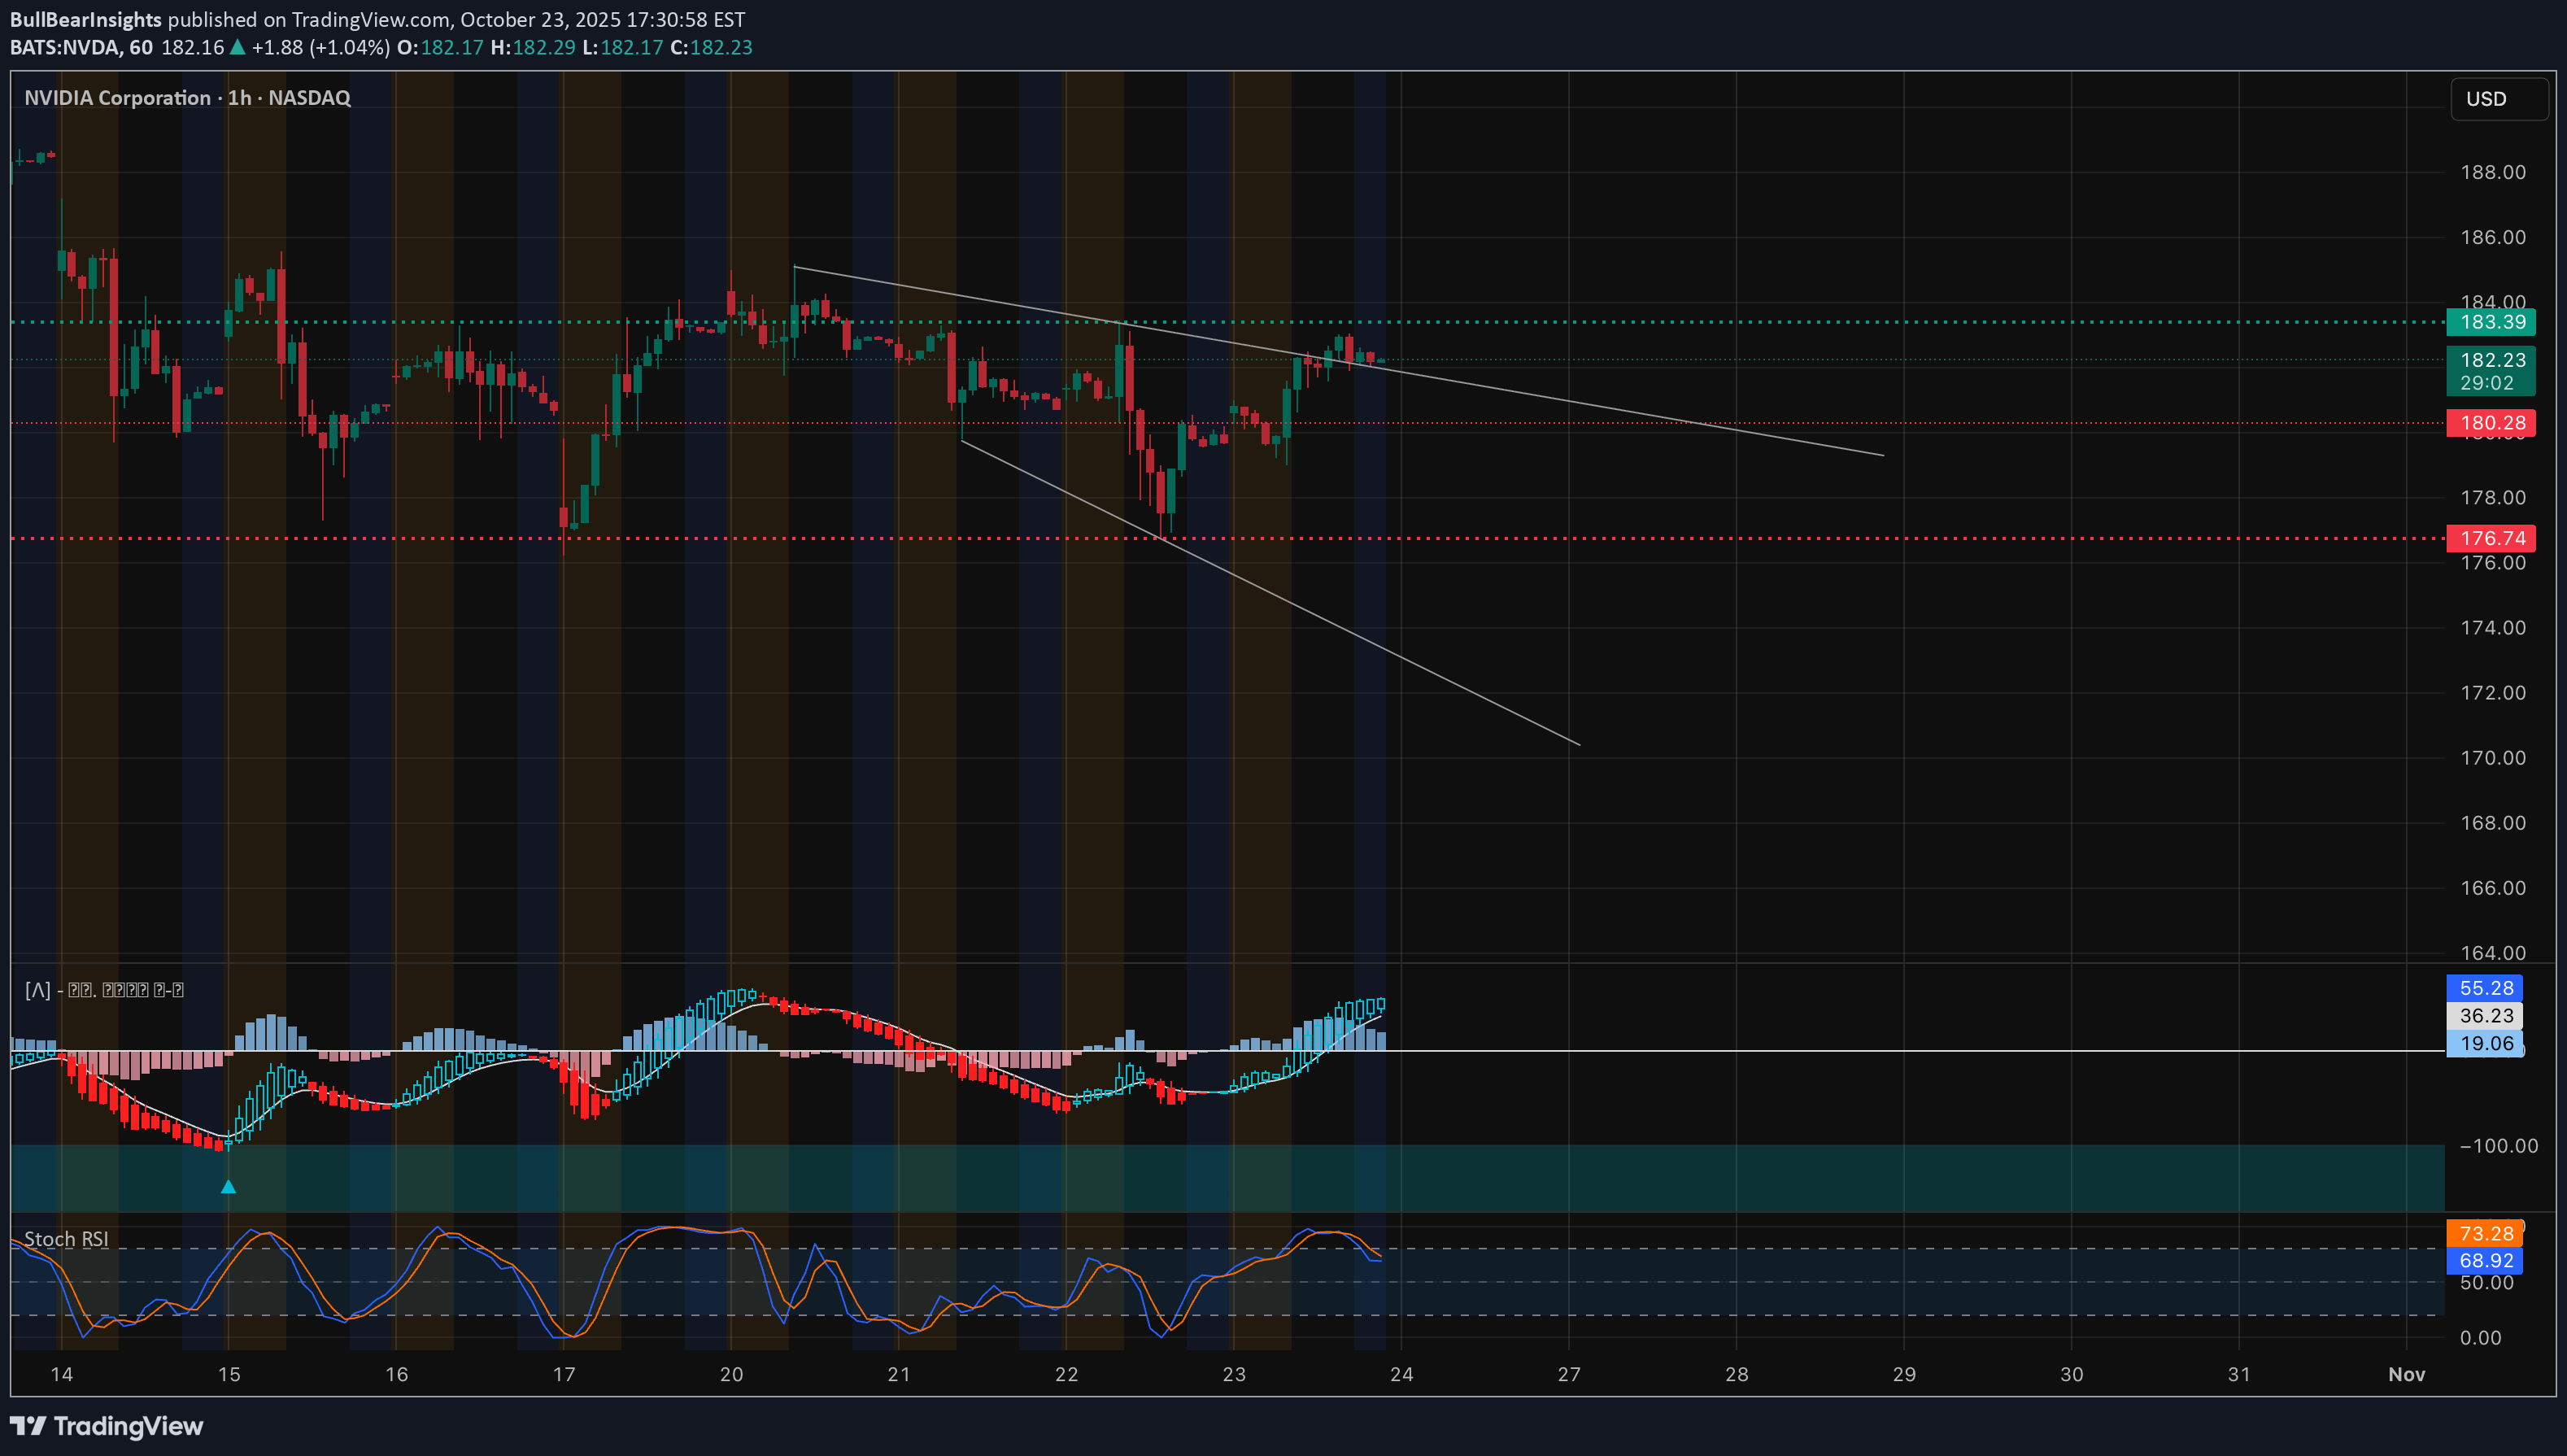
Will Bulls Reclaim $185 or Fade Back to $177? ⚡ 1. Market Structure (1H & 15M) NVIDIA’s price action has been quietly building a potential bullish reversal structure. On the 1-hour chart, we’ve seen a clear Change of Character (CHoCH) off the $176–$177 demand zone, flipping prior BOS levels and reclaiming short-term control. This suggests smart money likely absorbed liquidity below $175 earlier in the week. However, NVDA is still trading under a descending trendline from the mid-$180s highs. The latest 1H candle closed right below that resistance — meaning we’re at an inflection point heading into Friday. If bulls break above $183.50–$185, it confirms a structural shift toward higher highs. Failure here could keep NVDA locked in a range-bound corrective channel between $176–$183. On the 15-minute chart, we have multiple CHoCH and BOS confirmations in sequence — a bullish sign of internal structure rotation. Still, a recent CHoCH near $182.3 hints at possible profit-taking before the next leg. 2. Supply and Demand / Order Blocks * Demand Zone (Active Buyer Base): $176.5–$178, which coincides with previous BOS lows and the last high-volume push. * Short-Term Demand / Fair Value Gap Fill: $179–$180 — this could serve as the first bounce zone on any intraday dip. * Supply Zone (Distribution Area): $183.5–$185. This is the key test area for bulls; a clean break and retest here could trigger acceleration toward $188+. If sellers defend $185 again, expect a pullback toward $180. Momentum above that, however, exposes liquidity pockets up to $190–$192 (visible on the 1-hour gamma chart). 3. Indicator Confluence * 9 EMA / 21 EMA: On the 15M, both EMAs have crossed bullishly with price still riding above — showing near-term strength. On the 1H, the crossover just occurred, confirming fresh momentum as long as NVDA stays above $180. * MACD: Positive momentum expanding on the 1H chart, histogram rising with widening separation between signal lines. On 15M, momentum cooled slightly into close, likely just consolidation before next wave. * RSI: Hovering near 70 on the 1H — strong but not yet overextended. The 15M RSI reset toward 50, providing room for another upside push. * Volume: A steady increase through the $176–$182 leg suggests accumulation rather than distribution — a constructive sign for continuation. 4. GEX (Gamma Exposure) & Options Sentiment From the GEX map, $185 is the highest positive gamma and call wall, acting as the main magnet/resistance for Friday (10/24). The HVL (High Volume Line) support sits right around $177.5, which aligns with demand and prior BOS zones. On the downside, the 2nd and 3rd PUT walls are parked around $175 and $170, suggesting limited downside unless $176 breaks with force. Above $185, gamma positioning thins out — meaning a breakout could accelerate quickly toward $188–$190 as dealers hedge upward. Current IVR is 16.1, with low implied volatility, and call sentiment at 17.3%, showing conservative bullish flow — not overheated. This is often where short gamma moves start to form if price expands beyond the main gamma wall. In essence, $177 is the floor, $185 the ceiling, and whoever wins that range likely drives the end-of-week volatility. 5. Trade Scenarios for Friday, Oct. 24 Bullish Setup 🟩 * Entry Zone: $180–$181 on retest or breakout above $183.5 * Targets: $185 → $188 → $190 * Stop-Loss: Below $179 * Confirmation: Price holds above 9 EMA on 15M, MACD histogram stays positive, RSI > 55 Bearish Setup 🟥 * Entry Zone: $183.5–$185 rejection zone * Targets: $180 → $177 → $175 * Stop-Loss: Above $186.5 * Confirmation: MACD flips red with RSI divergence on 15M, CHoCH back below $180 6. Closing Outlook for Oct. 24 (Friday) Tomorrow, NVDA sits at a critical pivot. If buyers manage to push through $185 with volume, we could see a short-covering rally toward $188–$190 fueled by dealer hedging and gamma expansion. But if the breakout fails, $180 becomes the battleground for control again — and a break below that reopens the door to $177 and possibly $175. My personal take: the chart favors bulls slightly, but only if $180 holds firm. Watch for a liquidity sweep below $180 early Friday followed by a rebound — that would be the most high-probability setup for a Friday squeeze into $185+. 🎯 Final Thought: “NVDA’s coiling under $185 resistance — the next breakout or rejection there decides if Friday ends with a quiet fade or an explosive push toward $190.”Intraday Update (Oct 24) Price is consolidating inside a rising channel after a clean Break of Structure (BOS) near $185.9 earlier this morning. The structure remains bullish but slowing, suggesting possible consolidation before another leg higher. * Current Price: $185.30 * Trend Structure: Higher lows within the ascending channel * CHoCH Support: Around $184.3–$184.5 zone (acts as a short-term demand base). * BOS Confirmation: $185.9 level remains key resistance — a breakout here could open room toward $187+. * MACD: Momentum is cooling off; histogram shows flattening with signals converging — suggesting consolidation before next directional move. * Stochastic RSI: Resetting near mid-levels, implying potential for another push if buyers defend support. * Resistance: $186.00 → $187.20 * Support: $184.20 → $183.00 * Breakdown Risk: Below $182.8 could trigger liquidity sweep toward $181.8 zone. NVDA is holding a tight bullish structure but momentum has softened intraday. If $184.3 holds, expect continuation toward $187 once momentum reactivates. However, a clean break under $183 would shift bias to short-term bearish retracement before possible rebound near $181.8.