Technical analysis by BullBearInsights about Symbol GOOGLX on 10/22/2025

BullBearInsights
تحلیل تکنیکال GOOGL: آیا آلفابت آماده انفجار قیمتی تا ۲۶۰ دلار است؟
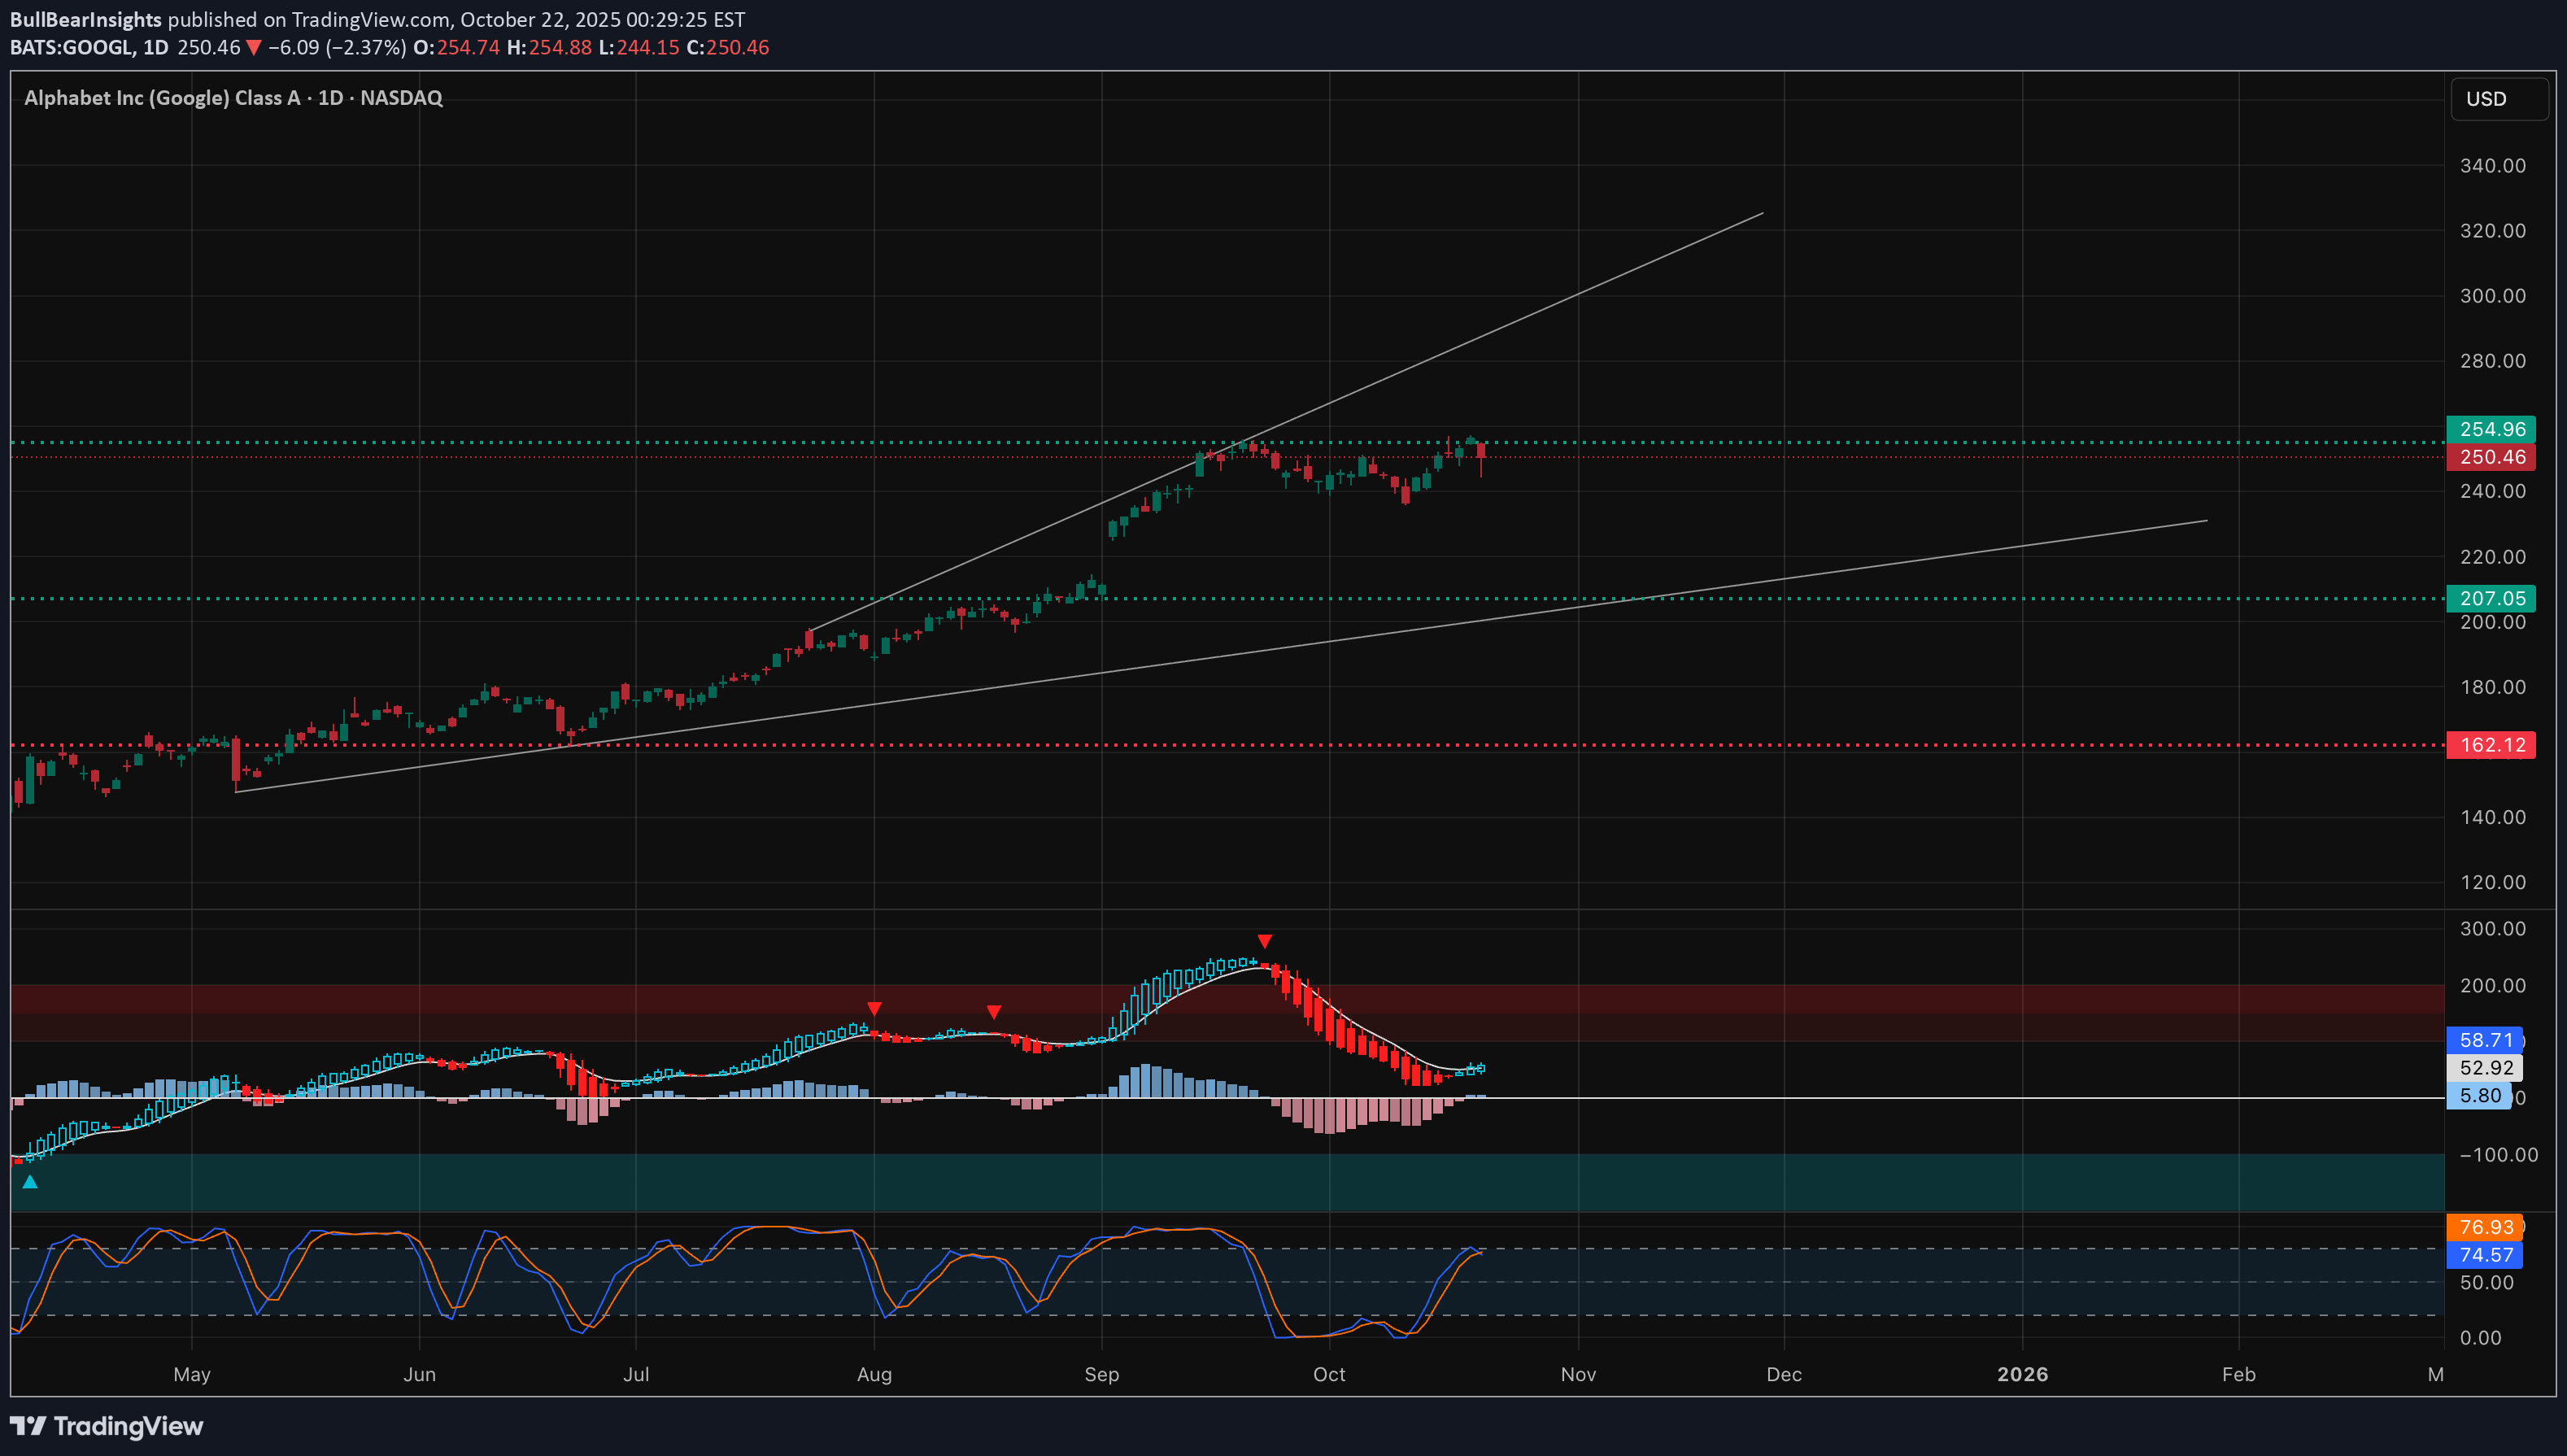
Bulls Eye $260 Gamma Target into Friday Close 🔥 🕒 Daily Timeframe – Macro Bias and Market Structure GOOGL remains in a strong macro uptrend, riding the ascending channel it’s respected since summer. Recent structure shows a CHoCH → BOS → CHoCH pattern near the $250–$255 range, signaling that smart money has been reaccumulating after the mid-October pullback. The $245 area acted as a liquidity sweep and re-entry base. Price has since reclaimed higher structure and continues to respect the channel trendline. * Trend: Bullish * Key Support: $245–$246 * Immediate Resistance: $257–$259 * Macro Target: $262–$265 range if $257 breaks * Indicators: * Daily 9 EMA > 21 EMA slope remains bullish. * MACD histogram rising from negative territory — early bullish continuation signal. * Volume supports steady accumulation, no blow-off tops seen. Summary: Daily trend still favors buyers; structure suggests preparation for another leg up once $257 is reclaimed. ⏰ 1-Hour Timeframe – Short-Term Trend and Smart Money Structure On the 1H chart, GOOGL shows a clear liquidity sweep below $246 last week followed by a strong CHoCH at $252 and a BOS over $255, confirming reaccumulation. Price is holding above intraday demand at $252–$253, and bulls are attempting to reclaim the critical $257 level. If a 1H candle closes above $257 with volume, expect momentum expansion toward $260–$262. * Trend: Bullish Bias * Support Zones: $252.4–$253.0 and $245.8–$246.0 * Resistance Zones: $257.0–$259.0 (BOS + GEX wall) * Indicators: * 9 EMA curling above 21 EMA — bullish transition forming. * MACD turning positive, histogram rising. * Volume showing renewed demand after Friday’s flush. Summary: Holding above $252 confirms buyers in control. A clean breakout above $257 triggers continuation toward the next liquidity pool. 📉 15-Minute Timeframe – Intraday Structure & Entry Precision The 15M chart reveals a breakout from a descending wedge with multiple CHoCH → BOS confirmations, marking a clear momentum shift to the upside. However, there’s still friction near $257.3 — a level acting as both supply and local liquidity cap. Expect short-term consolidation between $252–$257 before the next impulse move. * Bullish Entry: Above $256.5 on strong candle close. * Scalp Targets: * T1: $257.5 * T2: $260–$262 * Stop-Loss: Below $252.2 (beneath demand block and EMA support). * Bearish Setup: Rejection above $257 followed by CHoCH → BOS down confirmation. * T1: $252.5 * T2: $247.5 (liquidity + GEX defense). * Indicators: * 9 EMA > 21 EMA crossover imminent. * MACD bullish crossover, histogram rising. * Stoch RSI mid-zone reset — room for continuation. Summary: Momentum is building for an upside breakout. Watch $252 for demand defense and $257 for breakout validation. 💥 GEX & Options Sentiment – Dealer Positioning and Gamma Map The GEX chart paints a clear picture of where dealer positioning could steer price action: * Positive Gamma Zone: $255–$262 (dealer stability zone). * Key Call Walls: $257.5 → $260 → $262.5 — each a step toward potential gamma expansion. * Put Support: $247.5 and $242.5 — major defense levels tied to negative gamma. * Neutral Pin Zone: $252–$255, likely area of consolidation midweek before breakout. IVR: 53 – volatility moderate, great for swing setups. Flow: 34.6% Calls vs 46% IVx avg — balanced but leaning bullish; ripe for upside acceleration once $257 breaks. Implication: A breakout above $257.5 could trigger dealer hedging pressure upward, sending GOOGL toward $260–$262 into the weekend. Failure to hold above $255 reverts the stock back into the $252–$255 pin zone. 🧭 Final Outlook (Oct. 22–24) From Wednesday to Friday, expect range compression followed by directional expansion. * If bulls defend $252 and break $257 with conviction → likely gamma-fueled squeeze toward $260+. * If rejection repeats → short-term retest of $252 possible before reattempt higher. Structure, EMA alignment, and MACD confluence all point toward controlled bullish continuation. The setup favors swing traders looking to ride the next impulse leg. My plan: Watch for Wednesday retest near $253 → Thursday breakout confirmation → Friday gamma push toward $260+. Disclaimer: This analysis is for educational purposes only and not financial advice. Always manage your risk and confirm setups before trading.