Technical analysis by melikatrader94 about Symbol ETH: Sell recommendation (10/21/2025)

melikatrader94
تحلیل تکنیکال اتریوم: آیا ریزش تا ۳۸۰۰ دلار قطعی است؟ (الگوی سر و شانه)
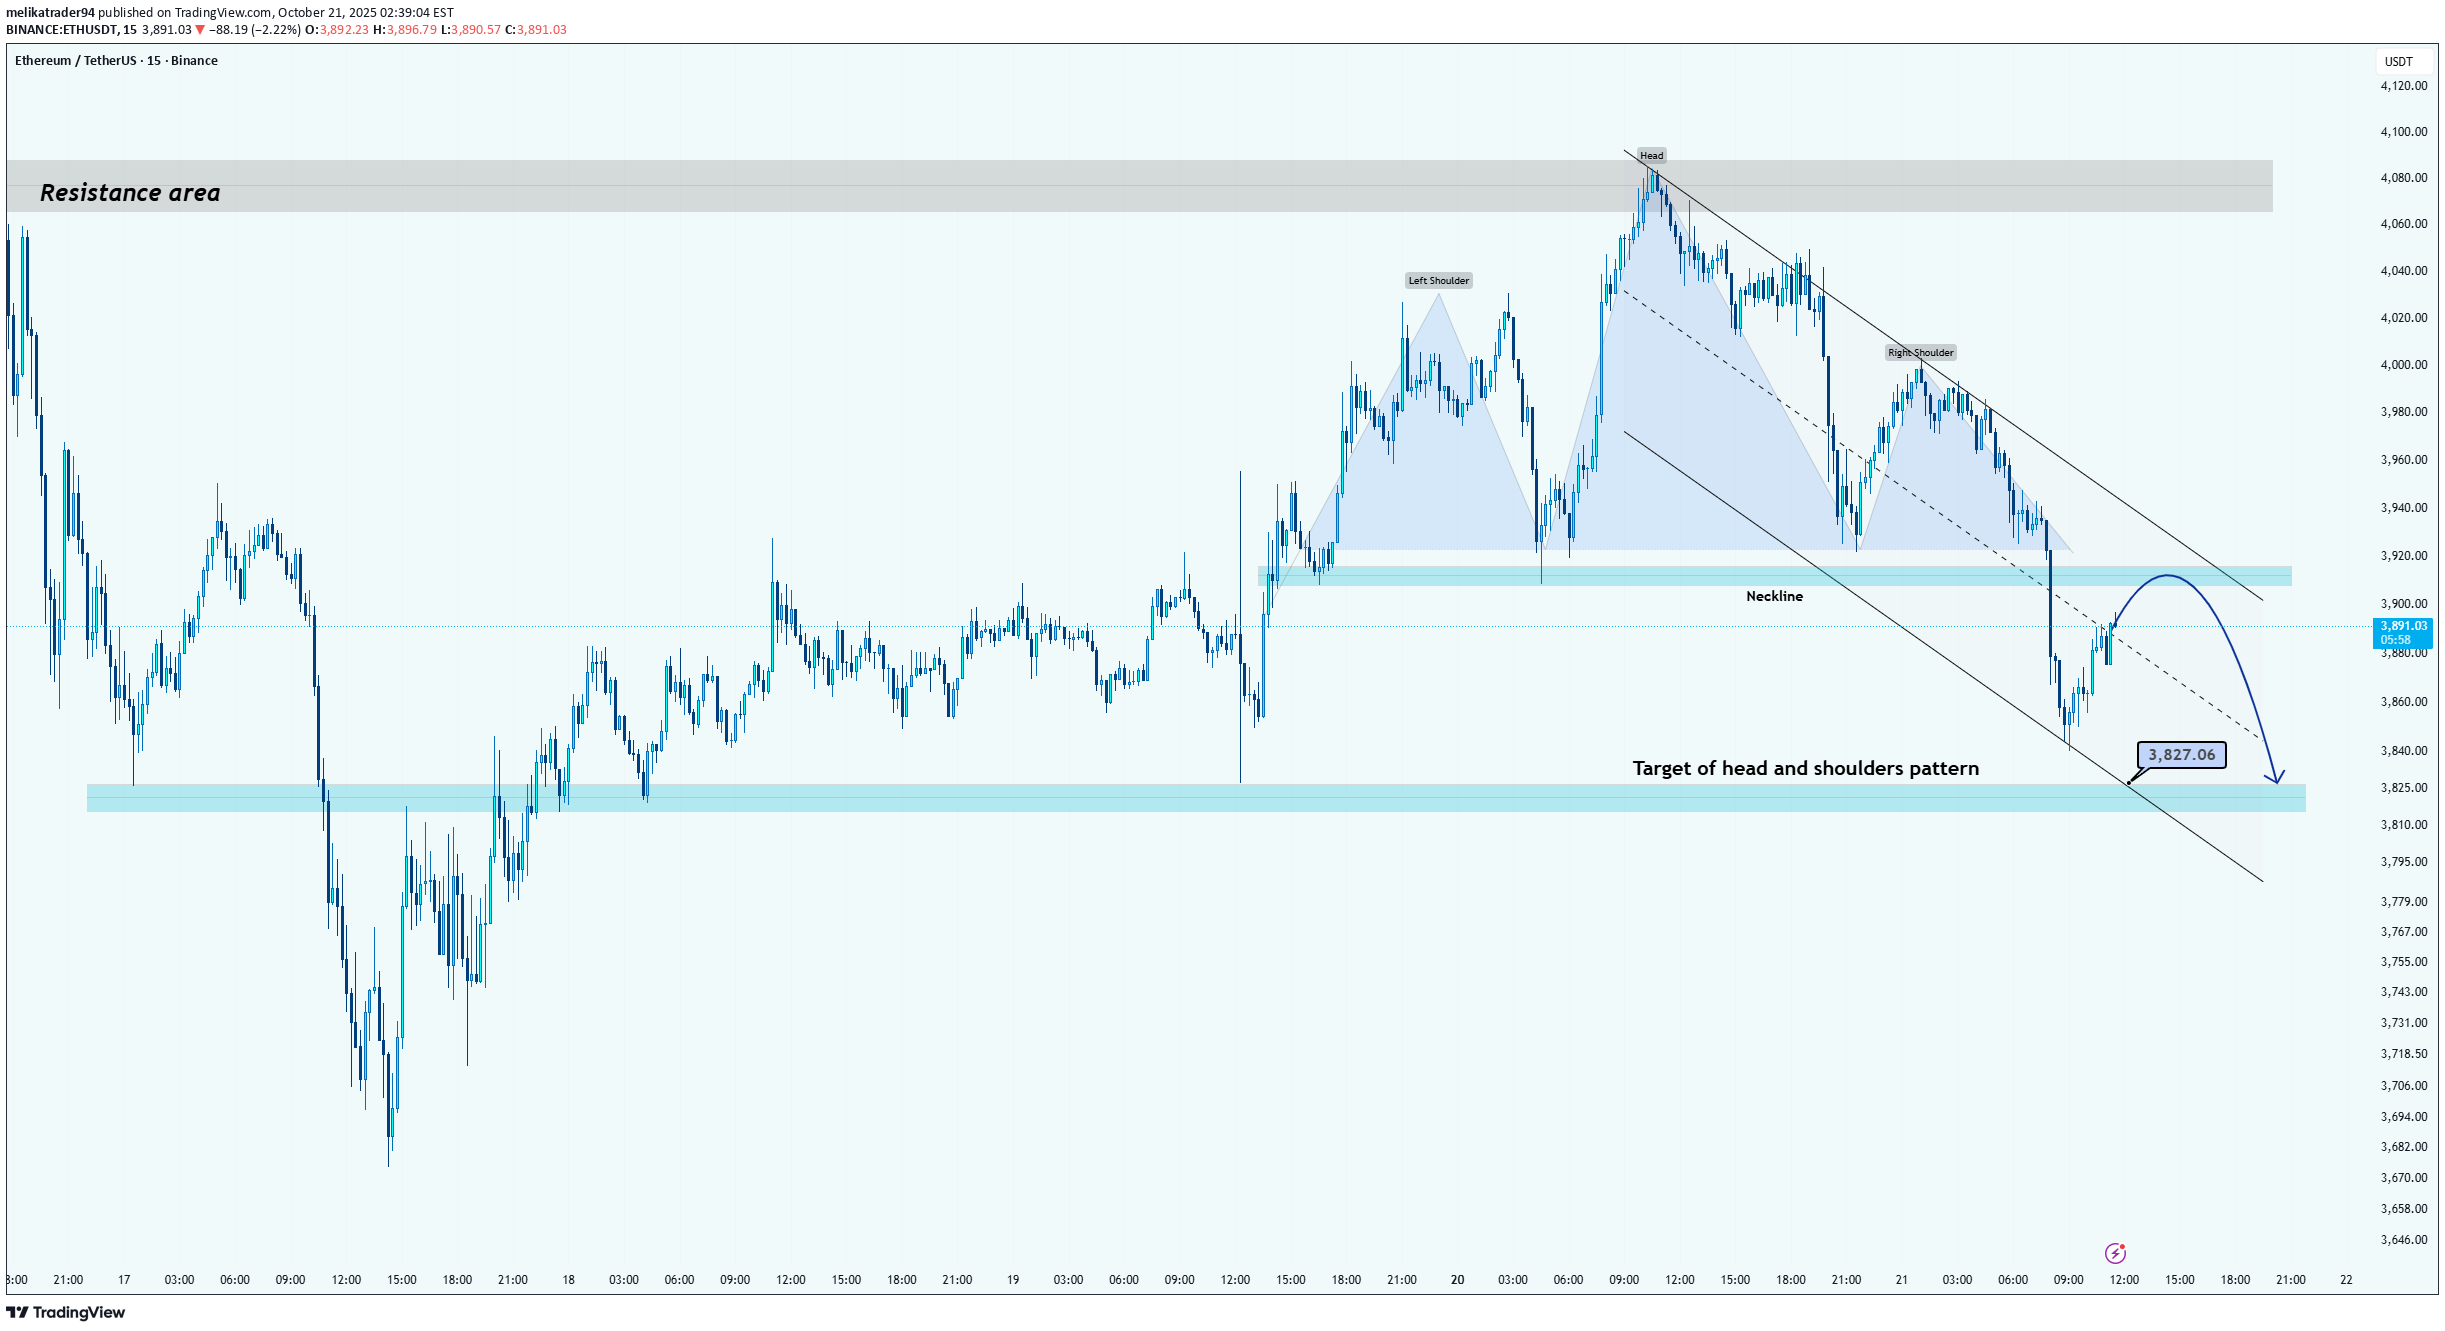
Hi Teams! Ethereum has recently completed a head and shoulders formation. The neckline around $3,920 was broken decisively, confirming the pattern and triggering further downside momentum. After the breakdown, the price slipped toward the lower boundary of the descending channel, finding temporary support near $3,860. A short-term corrective move is now unfolding, with ETH likely to retest the neckline zone and the upper boundary of the channel before facing renewed selling pressure. As long as Ethereum trades below $3,920–$3,940, the bearish structure remains valid. A rejection from this area could accelerate the decline toward the target of the head and shoulders pattern, which aligns with the $3,800–$3,820 support zone. However, a clear breakout above the descending trendline would invalidate this bearish outlook and could open the way for a recovery toward the $4,000–$4,050 resistance area. Levels to Watch: Resistance: $3,920 – $3,940 / $4,000 – $4,050 Support: $3,860 / $3,800 – $3,820 Bearish Target: Around $3,800 zone Outlook: Bearish while below $3,920.