Technical analysis by BullBearInsights about Symbol AAPLX on 10/19/2025

BullBearInsights
نبرد سرنوشتساز اپل (AAPL): آیا گاوها سقف ۲۵۵ دلار را پس میگیرند؟
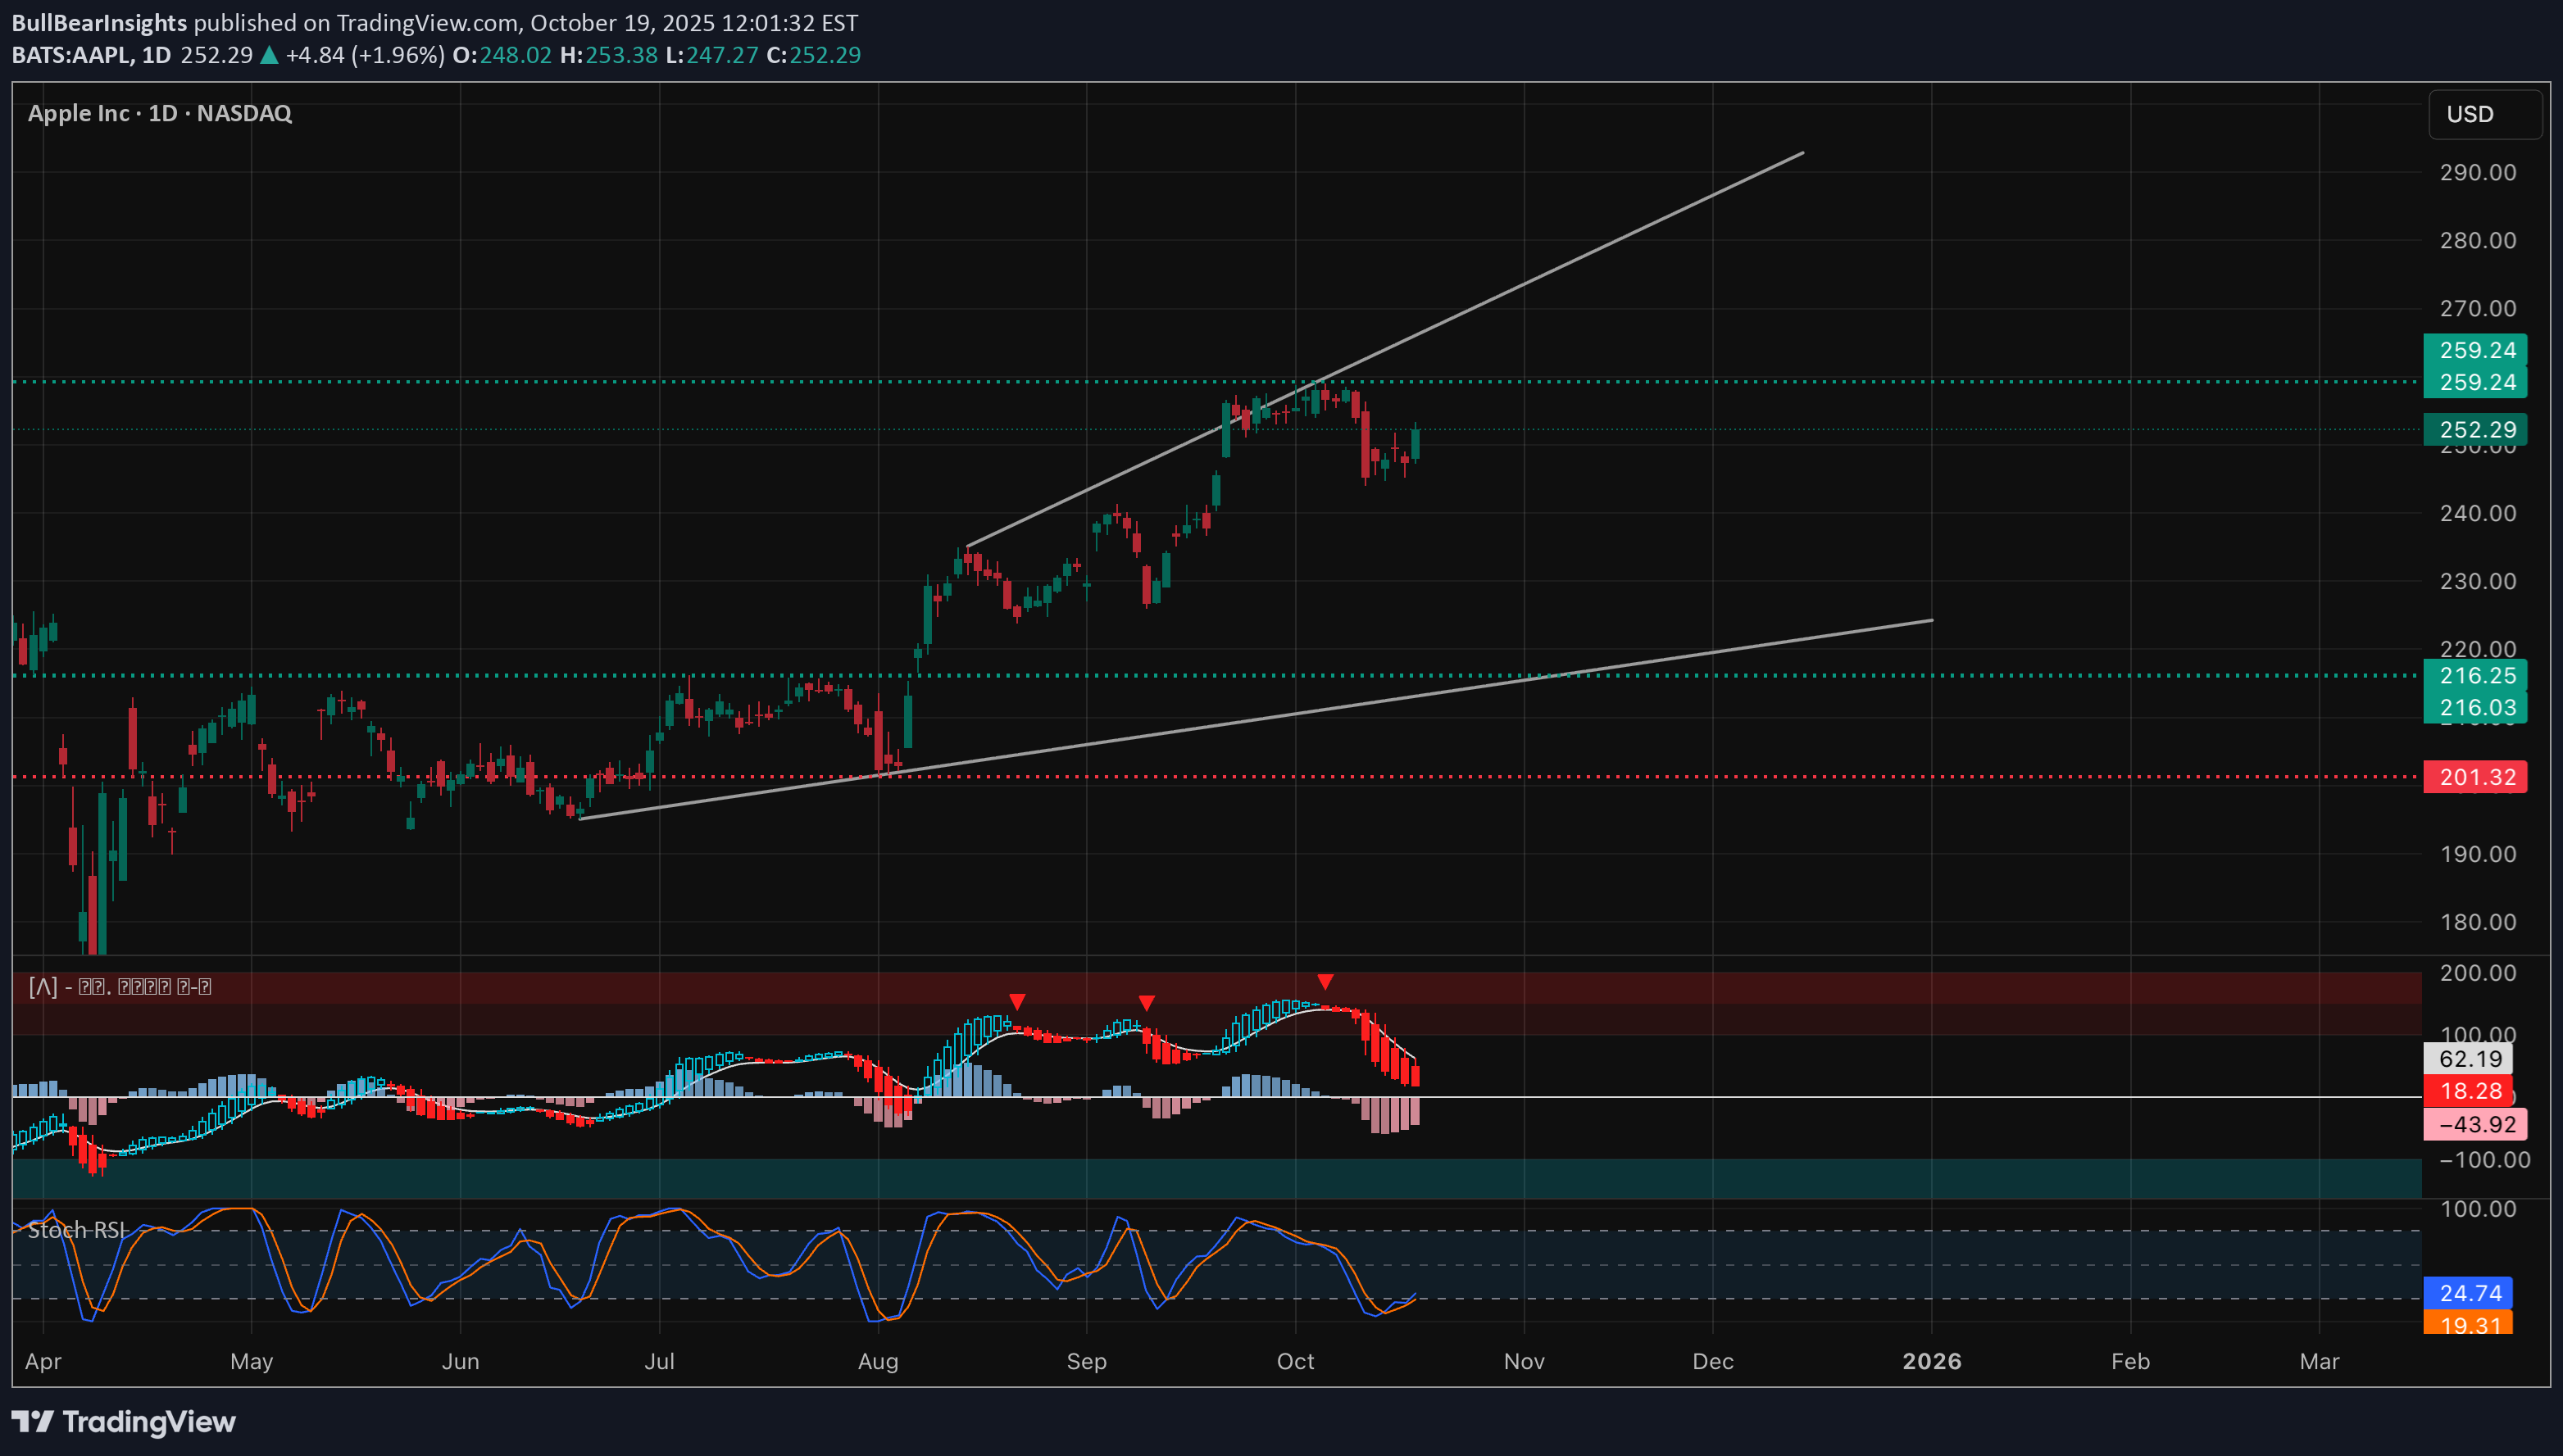
AAPL Gamma Battle Zone – Bulls Testing the $255 Ceiling Ahead of Earnings 🔥 🟩 Daily Timeframe – Macro Market Structure AAPL continues to ride within a clean ascending channel, maintaining higher highs and higher lows since the August reversal. The daily trend remains bullish overall, with price currently hovering near the upper midline of the channel. Last week’s rejection near $259–$260 showed short-term exhaustion, but the stock found solid support at $244–$247, a key demand area tested multiple times since September. This zone coincides with the previous CHoCH and liquidity sweep, where institutional buyers likely accumulated positions before the next leg up. If AAPL can sustain above $252, bulls may attempt another push into the $258–$260 supply zone — a critical decision area where we could see either renewed breakout momentum or another round of distribution. 🟦 1-Hour Timeframe – Structure, Momentum, and Volume The 1-hour chart shows a clear BOS (Break of Structure) following last week’s CHoCH near $247, confirming the transition back to a short-term bullish structure. The move from $247 → $252.5 came with increasing volume and clean EMA alignment, suggesting solid intraday demand. Price is now coiling under $253–$255, the first major resistance level in this new leg. Expect some chop here as liquidity builds before the next impulsive move. * 9 EMA crossed above 21 EMA and both are pointing upward — short-term bullish momentum intact. * MACD histogram remains positive but flattening, showing early signs of momentum cooling. * RSI sits around 60–65, leaving room for another push before overbought territory. As long as AAPL stays above $250.5, the bias remains bullish. A break below that would weaken short-term structure and could trigger a retest of the $247 zone. 🟨 15-Minute Timeframe – Intraday Precision Zones The 15-min structure gives the clearest roadmap for intraday traders. AAPL formed multiple BOS and CHoCH swings between $247–$253, with the latest impulse leg rejecting just below $254, a minor liquidity pocket inside the daily supply zone. We’re now seeing consolidation just above $250–$251, an important area where micro-liquidity is stacking. This zone may serve as an intraday pivot — break below it, and bears can drag the price to $248.5–$247.5. Hold above it, and bulls could reload for another retest toward $255. Momentum indicators show a cooling phase: * MACD histogram has started to fade, hinting at short-term consolidation or pullback. * Stoch RSI has cycled down from overbought but hasn’t yet reset fully — watch for crossovers near the lower band as early reentry signals. Expect liquidity sweeps around $251–$252.5 early in the week before any meaningful direction confirms. 🟥 GEX (Gamma Exposure) & Options Sentiment – The Dealer Map Gamma data paints a textbook pinning setup for the week: * Highest positive GEX / Call resistance: around $255–$260 — heavy dealer hedging pressure could cap upside. * Strong Put walls: $245–$242, directly aligning with the key daily demand. * Max Pain: near $250, often acting as a gravitational anchor when volatility compresses. * IVR 25.9, slightly under the 30-day mean, suggests option premiums are cooling, favoring range compression early week before a potential directional breakout. Dealer positioning currently supports a neutral-to-slightly-bullish gamma environment, meaning dips may find hedging support, but large rallies will likely face dealer sell pressure near $255+. Trade alignment thoughts: * Scalpers: Favor quick long scalps above $251.5 with targets $254–$255, keeping tight stops. * Directional traders: Watch for daily close over $259 to confirm breakout continuation. * Options players: Debit spreads or neutral iron condors between $250–$255 align with current GEX pin zone. 🎯 Trade Scenarios Bullish Setup 🟢 * Entry: Above $252.5–$253 after a confirmed candle close. * Targets: $255, then $259. * Stop-loss: Below $249.8. * Bias confirmation: MACD expansion and RSI > 60 on both 15M and 1H. Bearish Setup 🔴 * Entry: Rejection from $255–$257 or break below $250.5. * Targets: $247 → $244. * Stop-loss: Above $258.5. * Bias confirmation: MACD bearish crossover + RSI < 45 with EMA slope turning down. 🧭 Closing Outlook – Week of Oct 21–25 AAPL starts the week near equilibrium between demand ($247) and supply ($255). Expect early-week compression as dealers pin around $250–$252, followed by a potential gamma-driven breakout later in the week. If bulls defend $250, the structure favors another push toward $258–$260. Failure to hold that zone, however, could trigger a controlled pullback into the $247 support block. I’ll be watching closely for liquidity traps near $251–$252 — if price sweeps that zone and reverses with volume, it could mark the next momentum ignition for bulls. Disclaimer: This analysis is for educational purposes only and does not constitute financial advice. Always perform your own due diligence and manage risk accordingly.