Technical analysis by sunya about Symbol SPYX on 10/18/2025

sunya
تحلیل تکنیکال US500: ایستگاه حساس شاخص S&P 500 کجاست؟
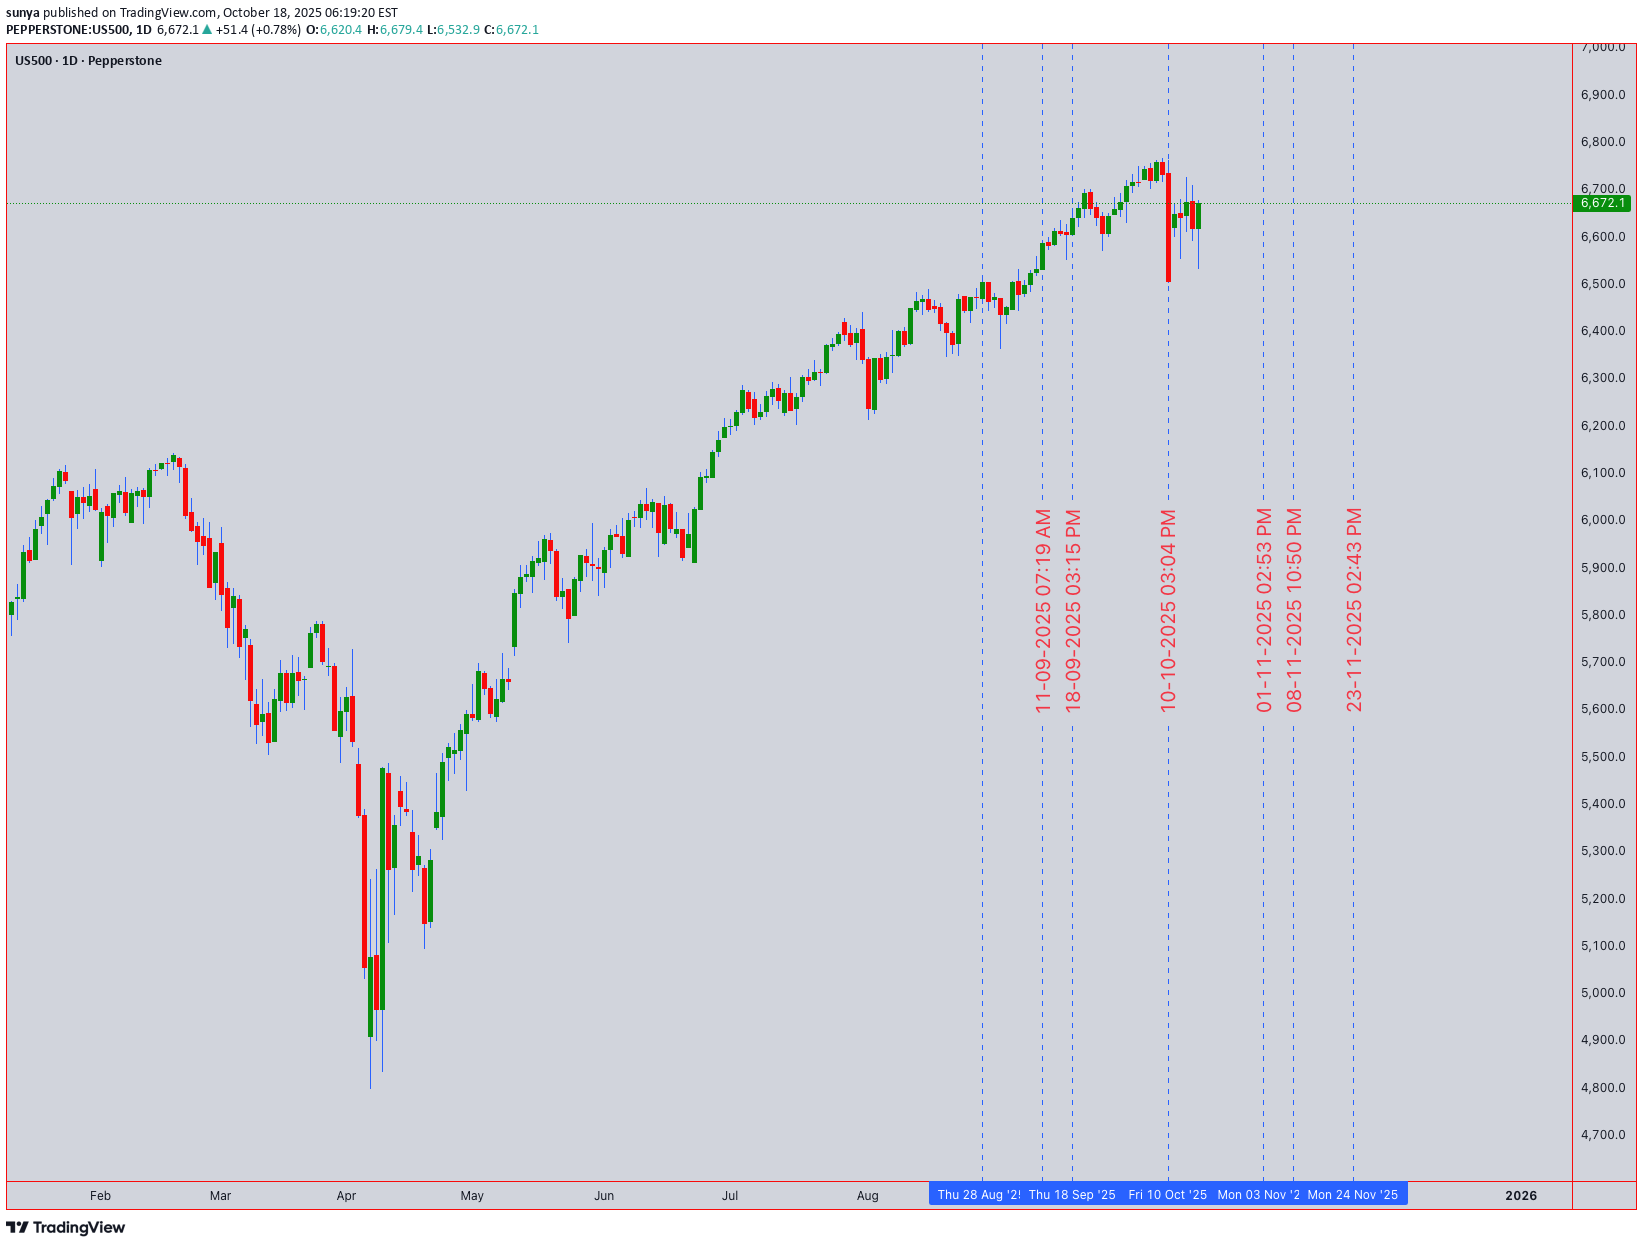
🎯 US500 (S&P 500) Technical Forecast: At a Critical Crossroad The US500 trades at 6,672.1, testing a major technical confluence. Our analysis points to a tense equilibrium between bulls and bears, with the next directional move set for a significant breakout. 📊 Multi-Timeframe Synthesis & Market Structure Daily (Trend Bias): The long-term trend remains cautiously bullish above the 6,600 support (50 EMA & prior resistance break). However, price action is compressing, indicating a loss of momentum and a potential coiling for a volatile move. 4H & 1H (Swing Setup): A potential Double Top pattern is forming, with the neckline near 6,640. The 4H RSI shows a pronounced bearish divergence, signaling weakening buying pressure. This is a primary warning for swing traders. Intraday (15M/5M - Precision): Immediate resistance is firm at 6,690 - 6,700 (psychological level). Support sits at 6,660. A break below 6,660 targets the 6,640 neckline. The 5M Anchored VWAP is capping rallies. 🧠 Key Technical Narratives & Theories Elliott Wave & Wyckoff: The structure from the last low suggests we may be in a complex Wave 4 correction or the final phase of a Wyckoff distribution (Upthrust After Distribution). A break below 6,640 would confirm this bearish narrative. Gann & Harmonic Levels: Key Gann support converges with the 0.382 Fibonacci retracement level near 6,620-6,630. This is the next major target if sellers overpower the 6,640 level. Ichimoku Cloud: On the 4H chart, price is trading within the Kumo (cloud), indicating a loss of trend direction and a battleground between buyers and sellers. ⚖️ Momentum & Volume Assessment RSI (14): Reading 49 on the 1D, neutral but bearish-diverged on lower timeframes. Bollinger Bands (20): Price is hugging the middle band, and bands are squeezing, indicating a period of low volatility that often precedes a high-volatility expansion. Volume & VWAP: Recent attempts to push higher have been on declining volume, a classic sign of a potential bull trap. Anchored VWAP from the recent swing low is now resistance. 🛠️ Trade Plan & Levels Swing Short Idea: Sell on a confirmed break below 6,640 (close on 1H), targeting 6,620 and then 6,580. Stop loss above 6,710. Intraday Short Idea: Sell on a break below 6,660 or rejection from 6,690, targeting 6,640. Stop loss above 6,705. Intraday Long Idea: Only consider buys on a strong break and hold above 6,700 with rising volume, targeting 6,730. Stop loss below 6,680. 💡 The Bottom Line The US500 is showing cracks in its bullish armor. The burden of proof is on the bulls to reclaim 6,700. Until then, the path of least resistance appears to be lower, with a break of 6,640 likely triggering a deeper pullback. Manage risk carefully in this volatile setup. Disclaimer: This is technical analysis, not financial advice. Trade at your own risk.