Technical analysis by BullBearInsights about Symbol GOOGLX on 10/16/2025

BullBearInsights
مقاومت گاوی گوگل (GOOGL): آیا روند صعودی شکسته میشود یا به سمت ۲۵۵+ میرود؟
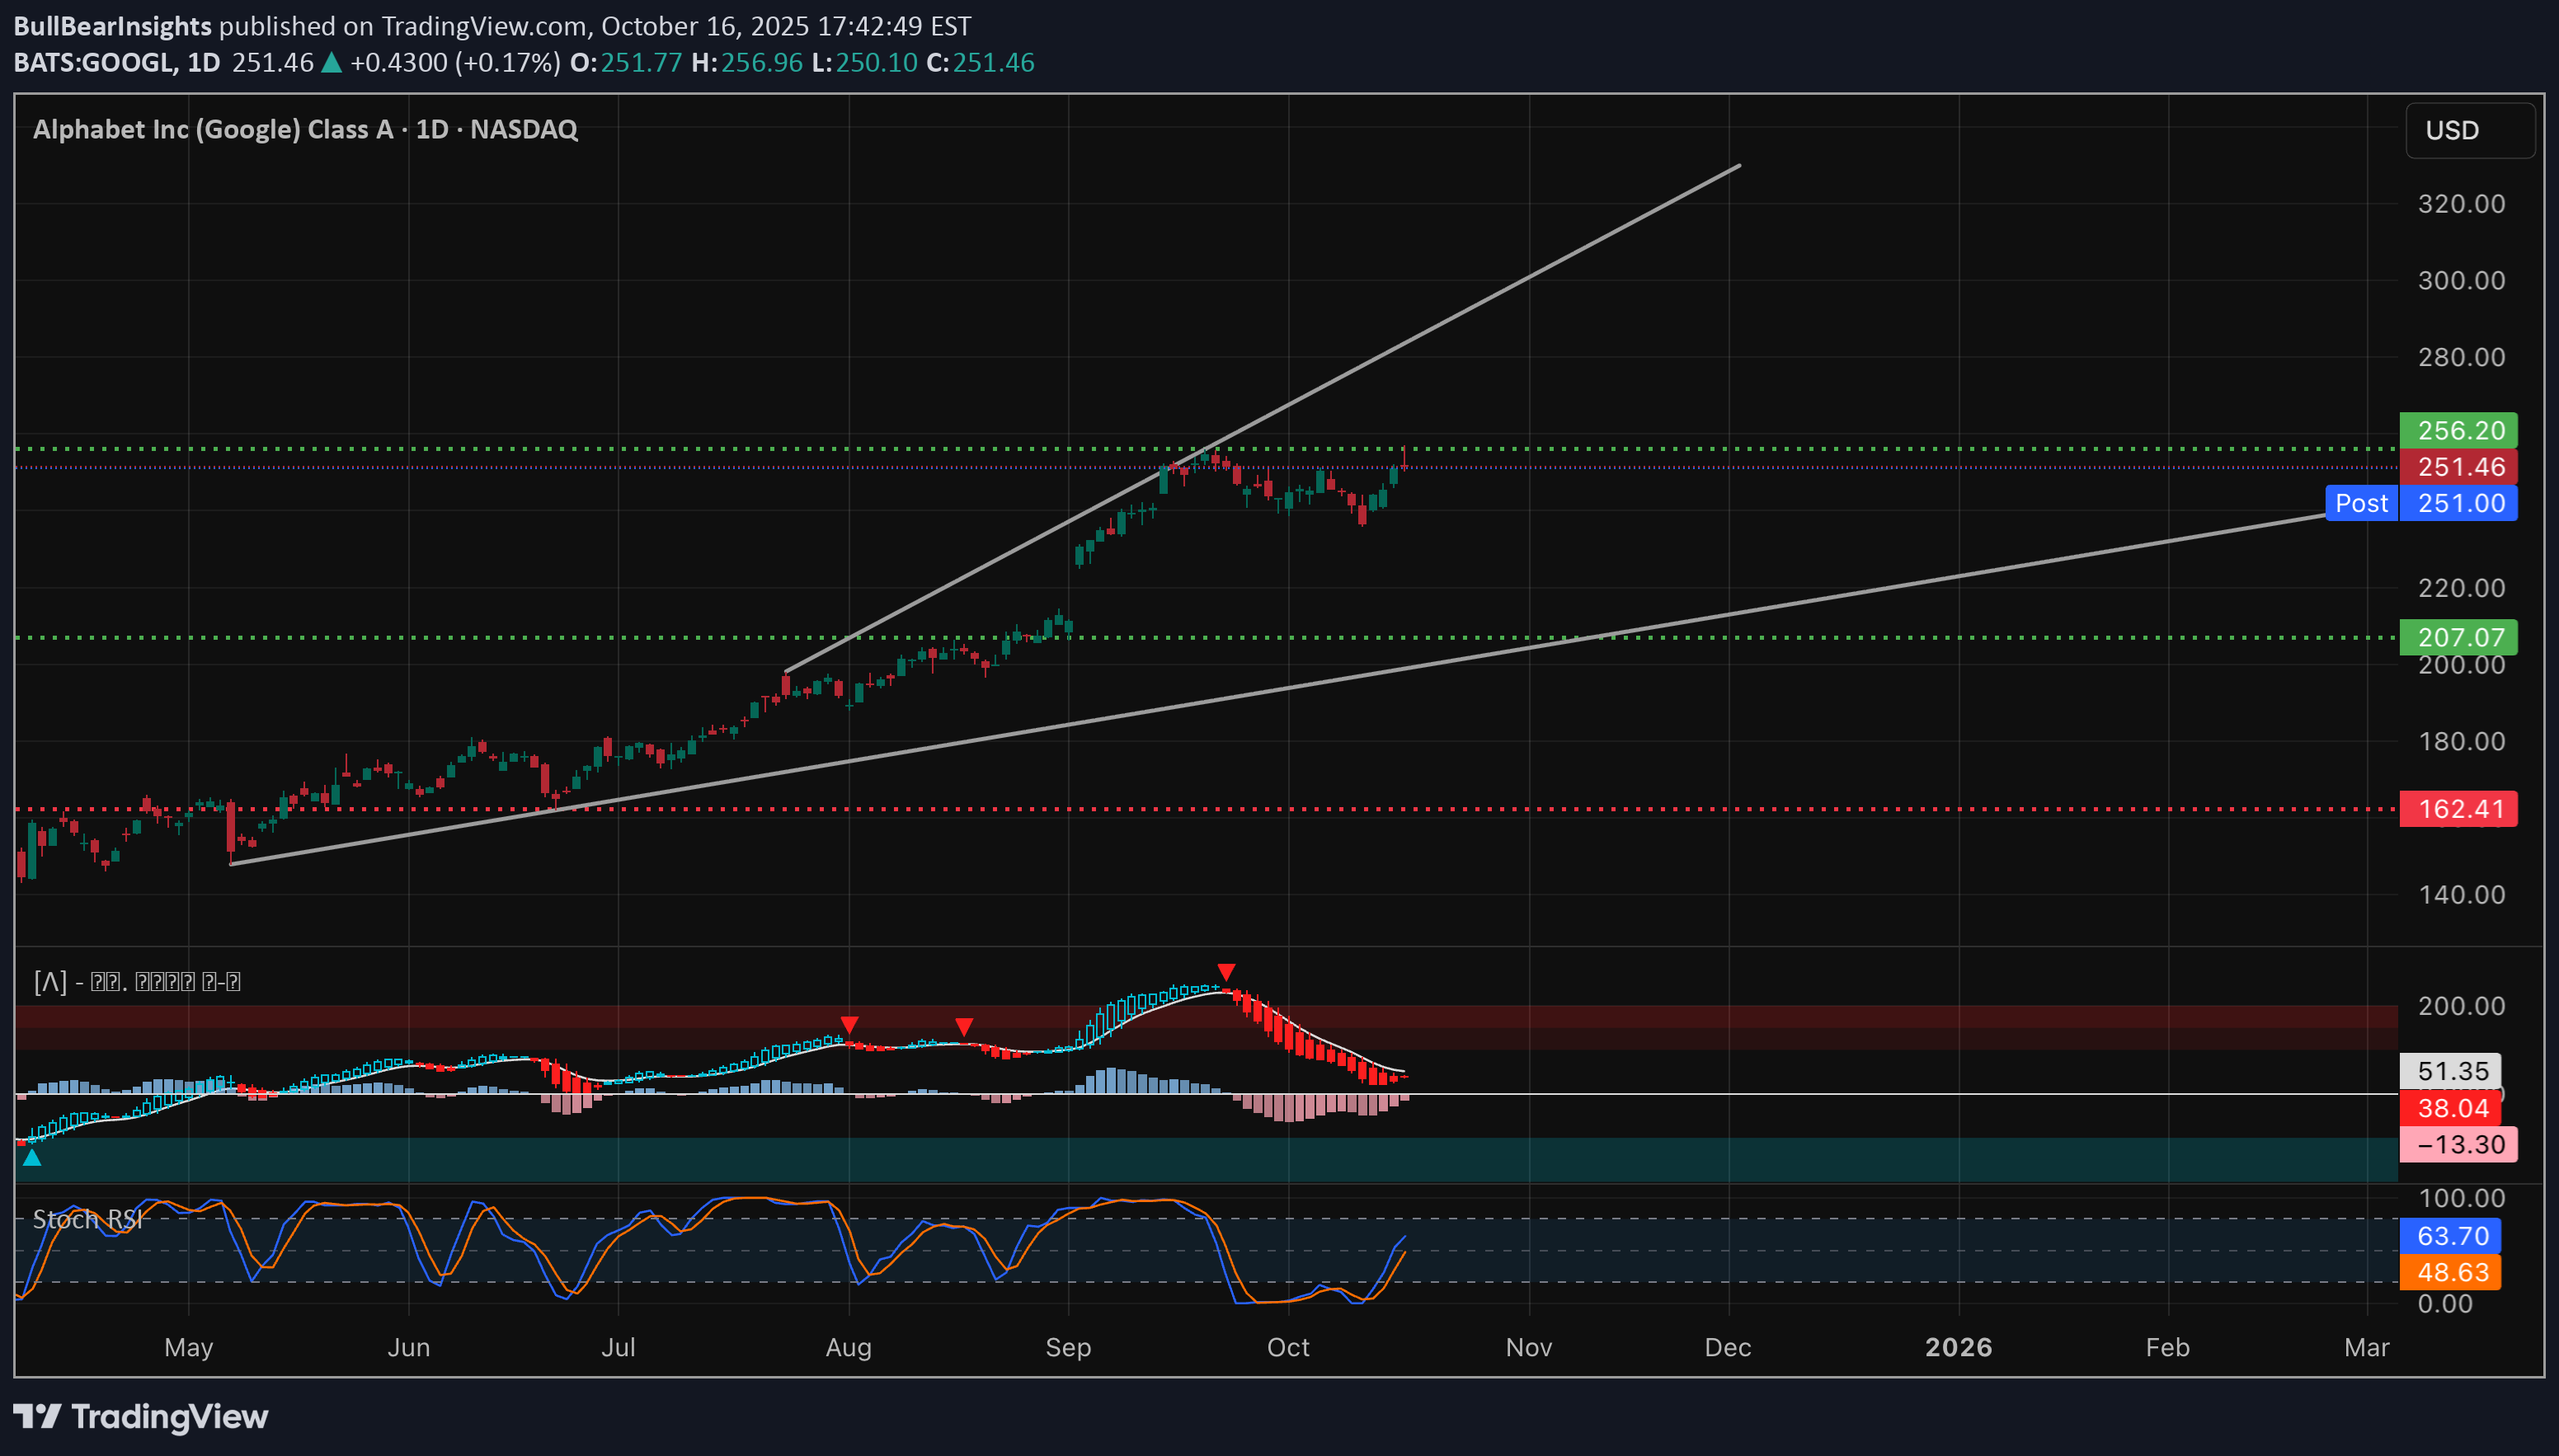
Bulls Defend the Trendline as Gamma Builds Near $251🔥” 📊 Multi-Timeframe Breakdown 🕒 1. Daily Chart – Macro Structure (“The Why”) GOOGL’s overall macro trend remains bullish after months of consistent higher highs and higher lows. The recent CHoCH near $253–$255 signals a temporary cooling phase following the parabolic August rally. Price continues to respect the ascending channel drawn from the May low, currently retesting mid-channel support around $246–$248. Momentum indicators show a natural consolidation within an ongoing uptrend — not a breakdown. Macro Bias: Still bullish unless $236 breaks, but short-term correction pressure is evident. Smart money appears to be redistributing positions near the upper channel after an extended run. ⏰ 2. 1-Hour Chart – Active Market Structure (“The Setup”) https://xhttps://www.tradingview.com/x/Iblu5YtL/ The 1-hour chart shows a clean BOS → CHoCH pattern as GOOGL transitioned from impulsive buying to range-bound behavior. Price broke structure above $247, extended to $256.9, and has since pulled back to retest the $247–$249 demand zone, which also aligns with a prior FVG fill and trendline support. Both 9 EMA and 21 EMA are starting to flatten, signaling that momentum is stabilizing after the early-week push. The MACD shows weakening histogram bars with the line nearing a crossover — a neutral stance leaning slightly bearish intraday. If price holds above $247, this could serve as a base for another breakout attempt next week. Key Levels: * Support: $247.0 → $244.8 → $240.0 * Resistance: $251.5 → $256.9 → $260.0 💹 3. 15-Min Chart – Intraday Execution (“The How”) On the 15-min timeframe, price structure has compressed into a tight consolidation range between $250–$253, with visible CHoCH and BOS oscillations — textbook accumulation behavior before a Friday directional move. The MACD histogram is flattening near zero, and Stoch RSI is curling upward from oversold territory, hinting at possible bullish relief. If bulls defend the intraday BOS zone at $250, a squeeze into $253–$256 is highly possible. But if $249 breaks with volume, downside liquidity targets open fast toward $245–$243.5 (previous imbalance fill zone). Scalp Play Idea: * Bullish: Enter above $252.0, target $255.5–$257, stop below $249.8. * Bearish: Enter on breakdown below $249.0, target $245 → $243, stop above $251.8. 📈 4. GEX (Gamma Exposure) Chart – Dealer Positioning (“The Fuel”) Friday’s option structure shows a tight gamma cluster forming near GOOGL’s current price: * Highest positive GEX / Call Resistance: $255–$257 * Gamma Pivot (HVL): $251–$252 → current trading zone and likely magnet. * Put Walls: $242 → $237 * Max Call Walls: $260–$265 Dealers remain slightly long gamma around current levels, which could suppress volatility until price decisively breaks out of the $247–$253 band. If GOOGL pushes above $253, hedging could flip supportive, triggering a controlled gamma squeeze into $256–$258. Conversely, breaking below $247 could flip dealers short gamma, expanding volatility into next week toward the $242 support cluster. Volatility Note: * IVR 59.3 and IVx avg 47.8 show traders expect higher-than-normal movement. * Call flow 22.8% vs Put flow 77% — suggests more hedging on downside exposure, meaning a quick reversal could trap shorts if SPY remains firm Friday. 🎯 Final Outlook Friday’s GOOGL tone revolves around whether bulls can defend $247–$249. If that zone holds, the stock could retrace back toward $255+ into the weekly close — especially if SPY or QQQ sustain their bounce. However, if the trendline cracks and volume expands below $247, expect a controlled gamma unwind that could drag price into $243–$240 before stabilizing. Personally, I’m watching for a fake breakdown setup under $249 that reclaims $251 with volume — that’s a classic Friday reversal pattern with asymmetric reward. Disclaimer: This analysis is for educational purposes only and not financial advice. Always manage your risk and trade responsibly.