Technical analysis by CryptoSanders9563 about Symbol ETH: Buy recommendation (10/13/2025)

CryptoSanders9563
تحلیل هفتگی اتریوم (ETH/USDT): راز تشکیل "فنجان و دسته" و هدف صعودی 7000 دلاری!
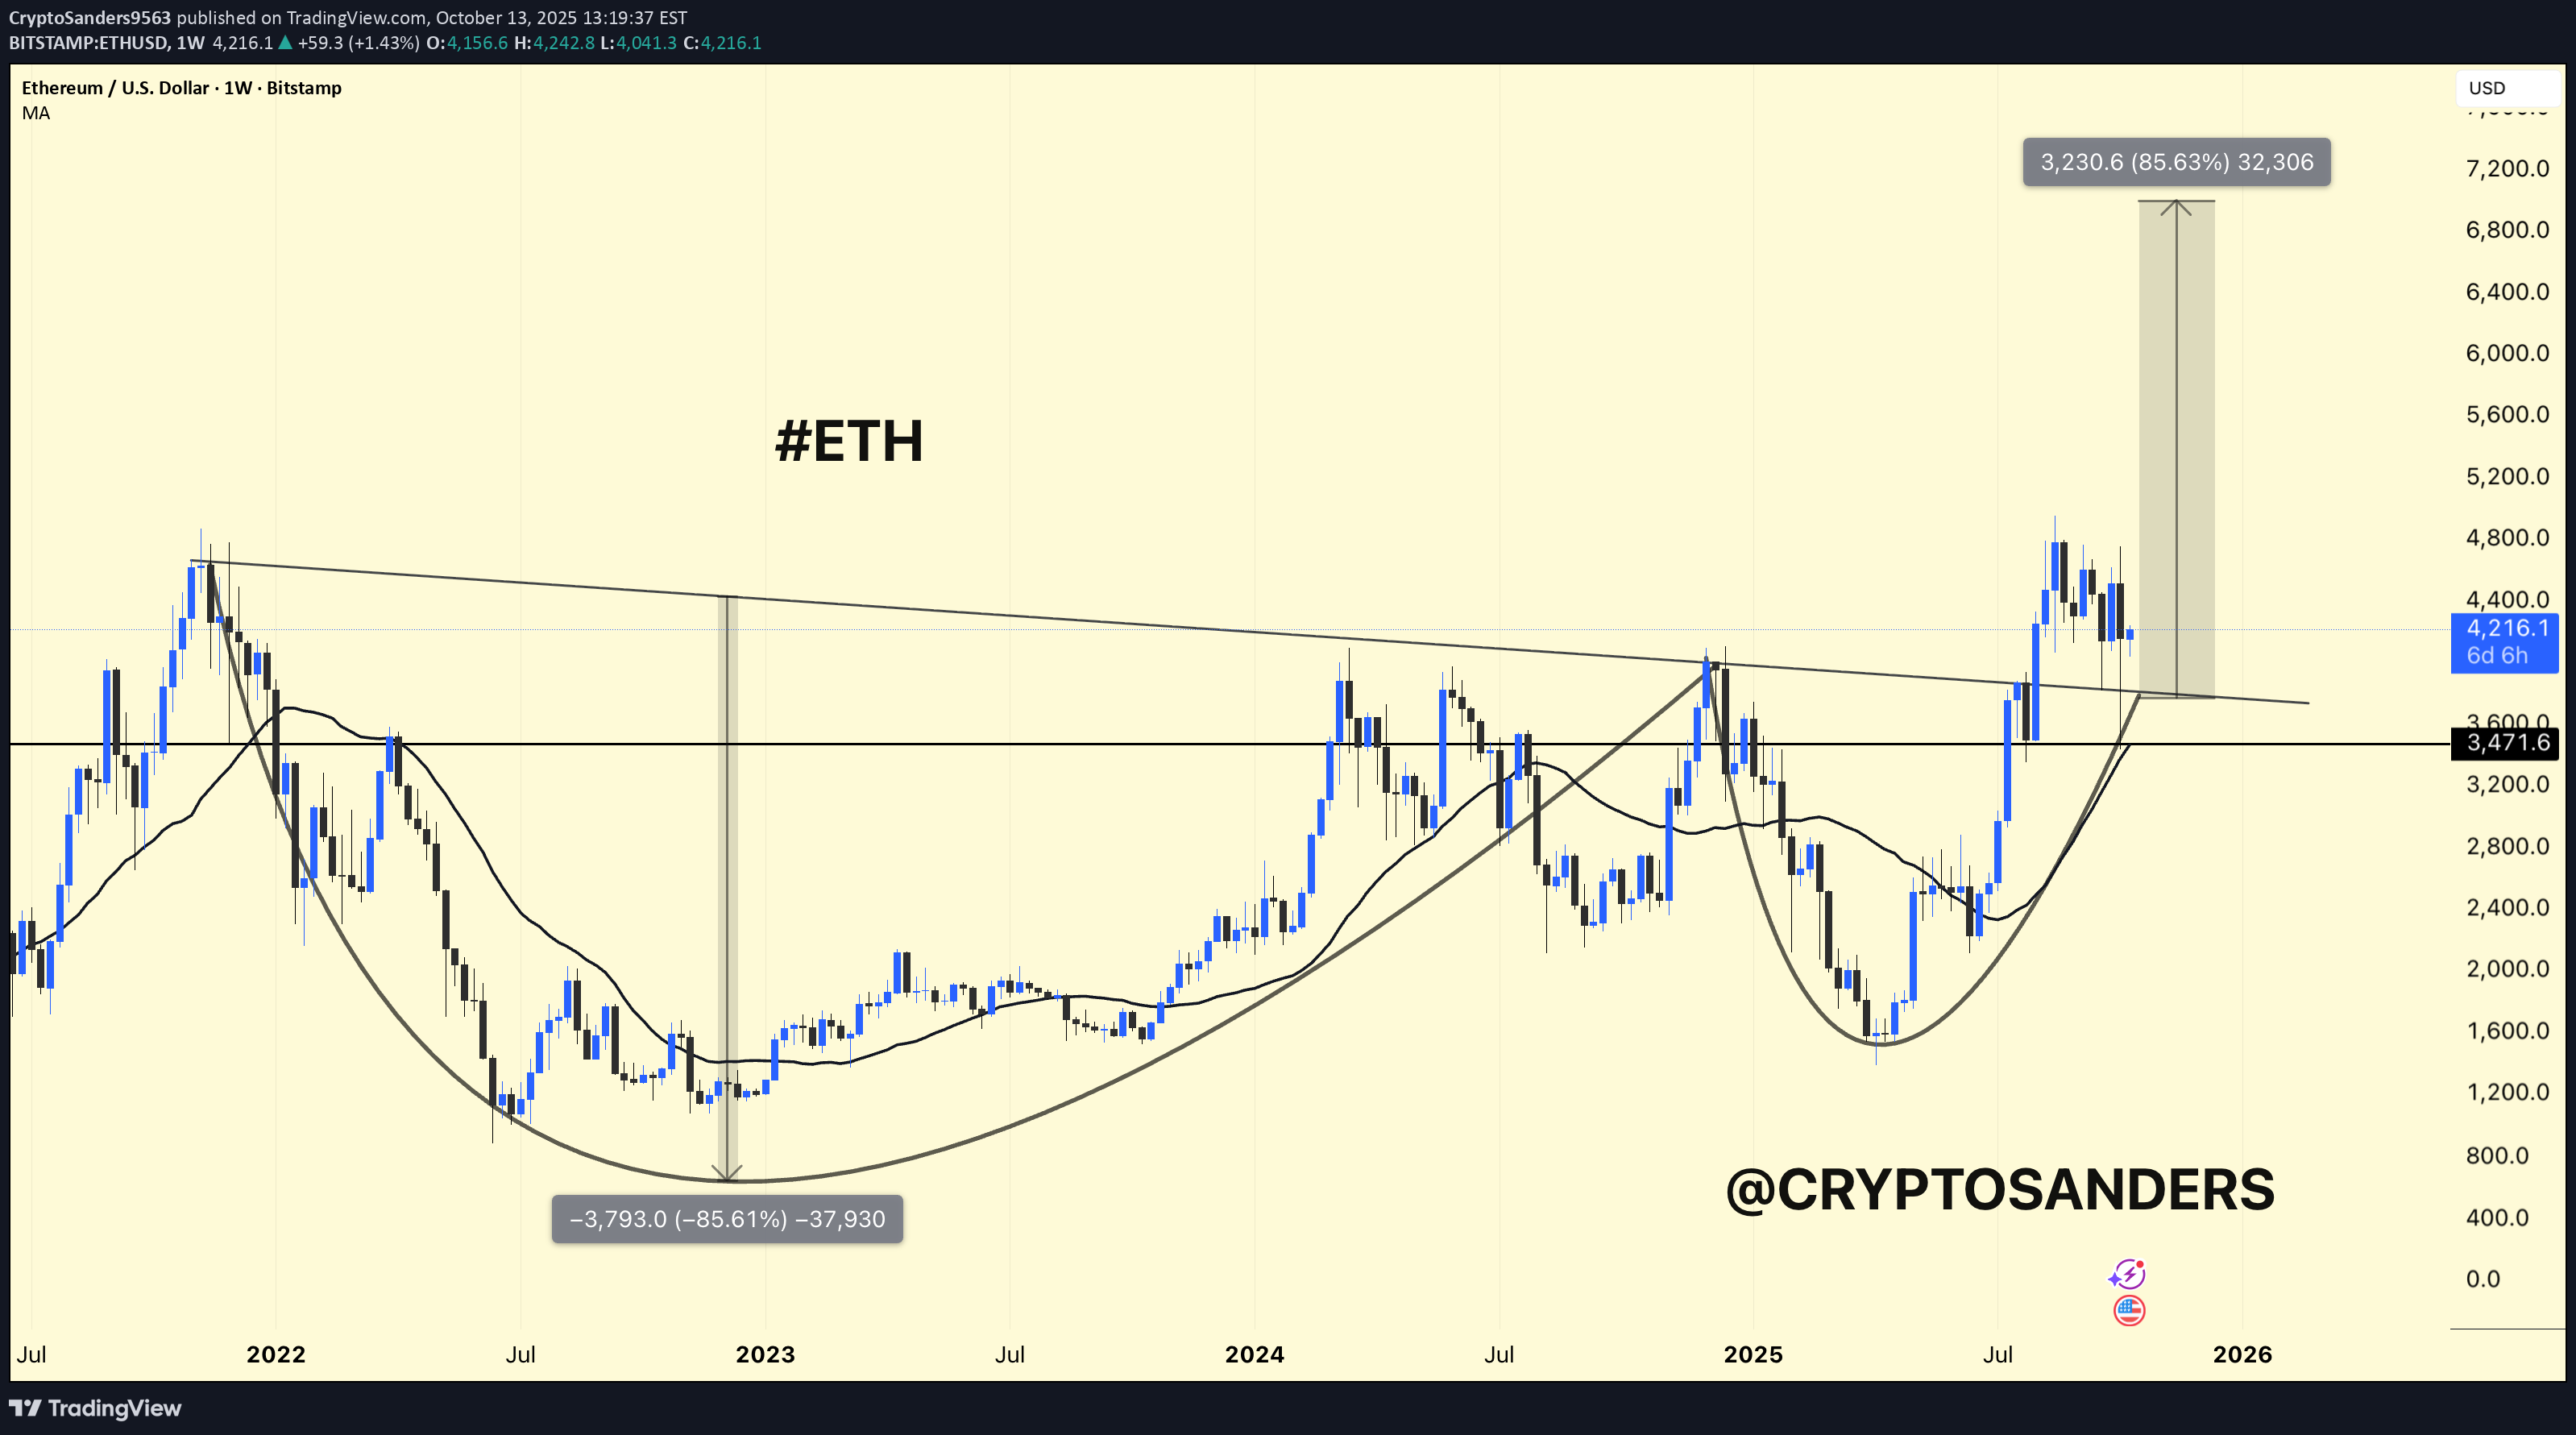
ETH/USDT Weekly Chart Analysis. Structure: The chart shows a large cup-and-handle pattern – a classic bullish formation that signals a long-term trend reversal. Current Price: Around $4,150, trading above the $3,470-$3,600 support area, which was the previous breakout area. Moving Average (MA): ETH remains above the weekly MA (~$3,460) – confirming bullish momentum. Breakout Area: The key downtrend line of 2022 has already been broken to the upside, showing strength. Upside Target: If ETH maintains a price above $3,600, a potential upside move towards $7,000-$7,200 (≈ approximately +85%) is possible, as shown in the chart. ETH is consolidating after its breakout, remaining stable above its support level. Holding $3,600 → Bullish momentum likely to continue. Loss of $3,400 → Could trigger a deeper decline towards $3,000. DYOR | NFA