Technical analysis by sunya about Symbol PAXG: Buy recommendation (10/11/2025)

sunya
پیشبینی طلا: رسیدن به قله تاریخی ۴۰۰۰ دلار و رمز موفقیت در این صعود انفجاری
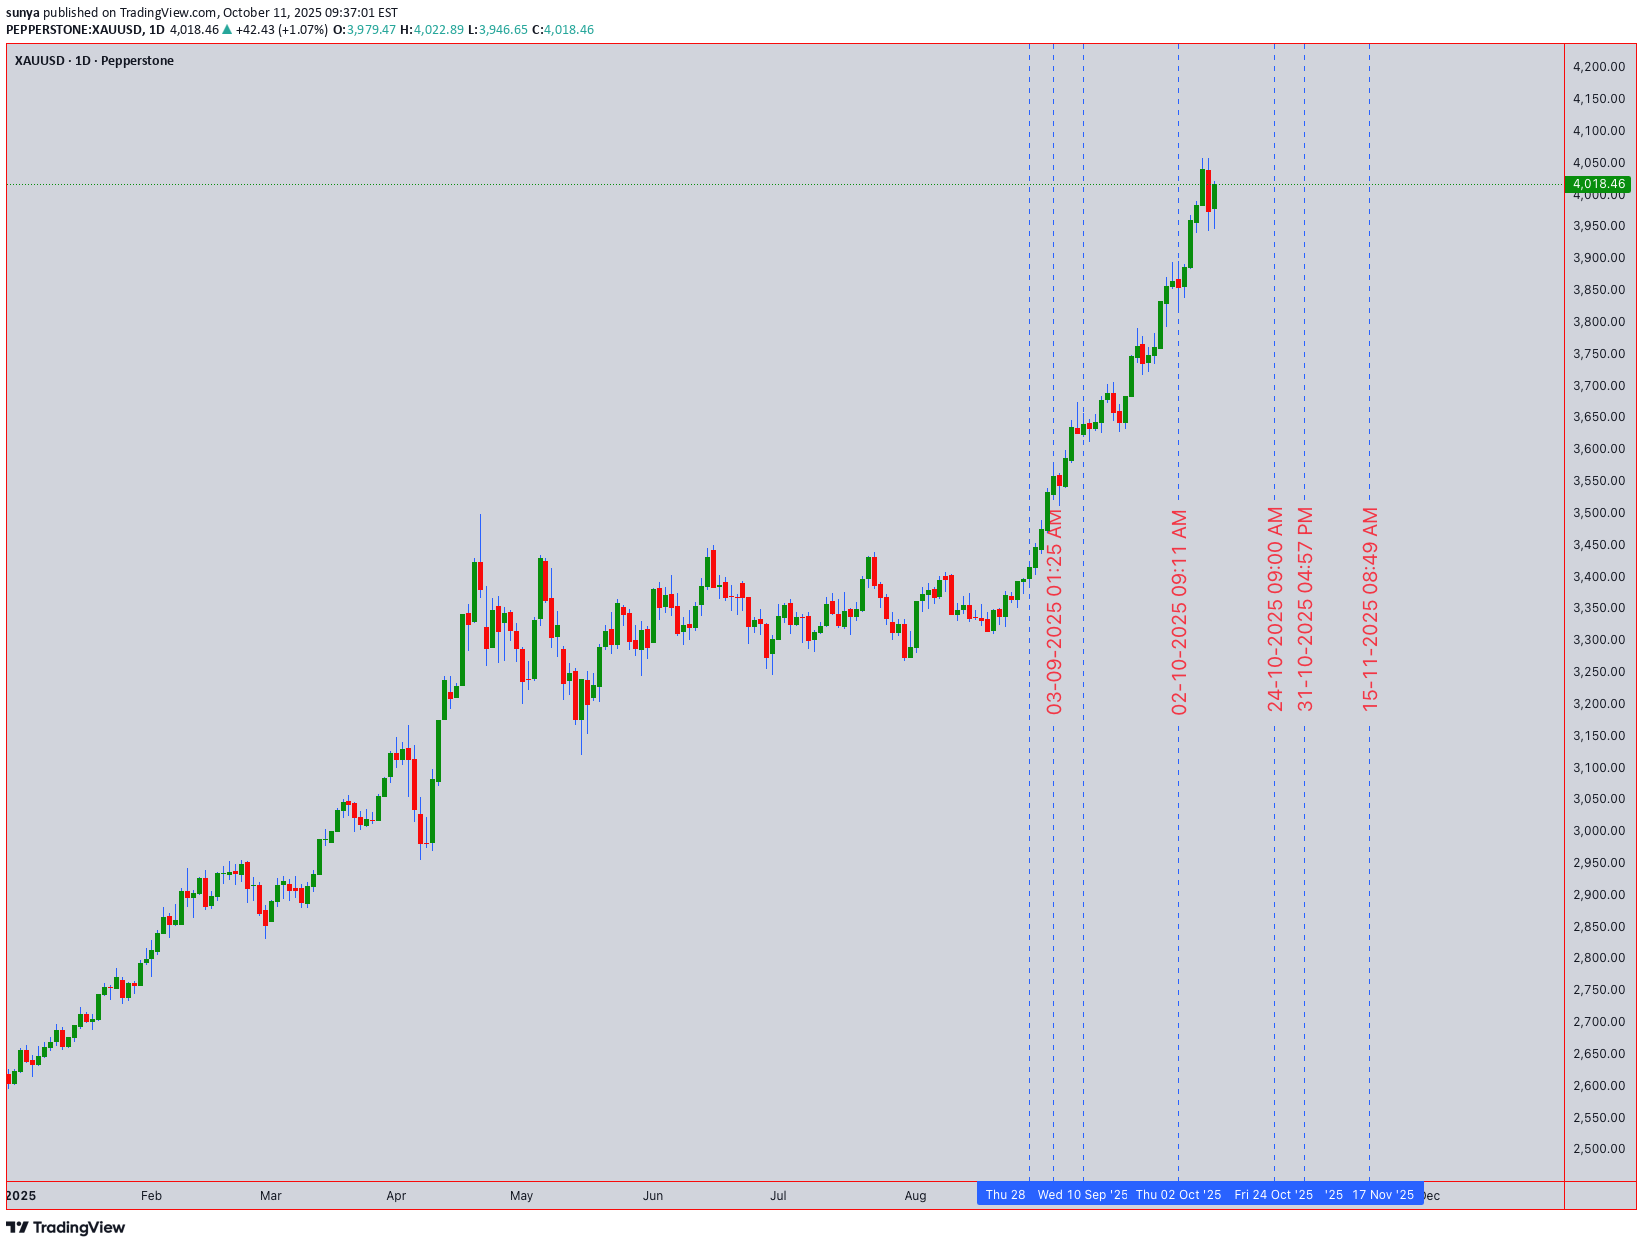
XAUUSD Technical Forecast: Gold at Historic $4,000+ Peak - Bullish Momentum Intact Asset: XAUUSD (Gold) | Closing Price: $4,018.46 | Bias: Bullish above key support, targeting new highs. 11th Oct 2025 UTC+4 1. Multi-Timeframe Market Structure & Key Levels Primary Resistance: $4,050 - $4,080. This is the immediate target and minor resistance zone. A break above opens the path to $4,120 and beyond. Critical Support: $3,980 - $4,000. This psychological and previous resistance-turned-support zone is crucial. A break below shifts bias to neutral. Major Swing Support: $3,950 (Confirmed by 4H chart structure). A break below this level would indicate a deeper correction towards $3,920. 2. Chart Pattern & Elliott Wave Context Pattern: Gold is in a powerful, near-vertical uptrend on the daily chart, trading in uncharted territory above $4,000. This is a classic momentum-driven breakout. Elliott Wave Count: The move from the September lows is a clear impulsive Wave 3 extension. We are likely in the later stages of Wave 3, with a Wave 4 correction expected soon. However, Wave 3 can extend further, so fading this trend is premature. Bull Trap Risk: Low in the immediate term. The sustained buying pressure and higher lows suggest genuine breakout strength, not a trap. 3. Indicator Confluence & Momentum Ichimoku Cloud (Daily): Price is soaring high above the Kumo (cloud), indicating an extremely strong bullish trend. The cloud is far below, providing a strong support base. RSI (14): On the daily chart, the RSI is in overbought territory (>70), which is typical for strong momentum moves. It can remain overbought for extended periods. Divergence is not yet present. Moving Averages: The 50 EMA (~$3,940) and 200 EMA are bullishly aligned far below the current price, confirming the long-term uptrend. No "Death Cross" is in sight. Bollinger Bands (4H): Price is consistently riding the upper band, a sign of exceptional strength. Any pullback would likely find initial support at the middle band (20-period SMA). Actionable Trading Plan Intraday Trading (1H/15M Charts) Bullish Continuation Setup: Trigger: Price holds above $4,005 and breaks $4,030. Buy Entry: On a retest of $4,015-$4,020 as support, or a break of $4,032. Stop Loss: Below $3,995. Targets: $4,050 (TP1), $4,070 (TP2). Bullish Dip-Buying Setup: Trigger: A pullback to the $3,990 - $4,000 support zone. Buy Entry: On a bullish reversal candle (e.g., hammer, bullish engulfing) in this zone. Stop Loss: Below $3,980. Targets: $4,030 (TP1), $4,050 (TP2). Swing Trading (4H/Daily Charts) Long Swing Entry: Condition: The trend is your friend. Any dip is a potential opportunity. Entry Zone: $3,980 - $4,000. Stop Loss: Below $3,950 (on a daily close). Target: $4,100+. Swing Trade Management: Consider taking partial profits at $4,050 and $4,080, then trailing your stop for the remainder to capture any parabolic move. Conclusion & Risk Note Gold is in a historic breakout. While overbought, the momentum is undeniable. The strategy is to buy supported dips rather than chase at the absolute top. The $3,980 level is the line in the sand; a break below would signal the first sign of weakness and a potential for a deeper Wave 4 correction. Until then, the path of least resistance is higher.