Technical analysis by sunya about Symbol BTC on 10/4/2025

sunya
بیت کوین در اوج تاریخی: آیا این صعود ادامه دارد یا اصلاح سنگین در راه است؟ (تحلیل کلیدی BTCUSD)
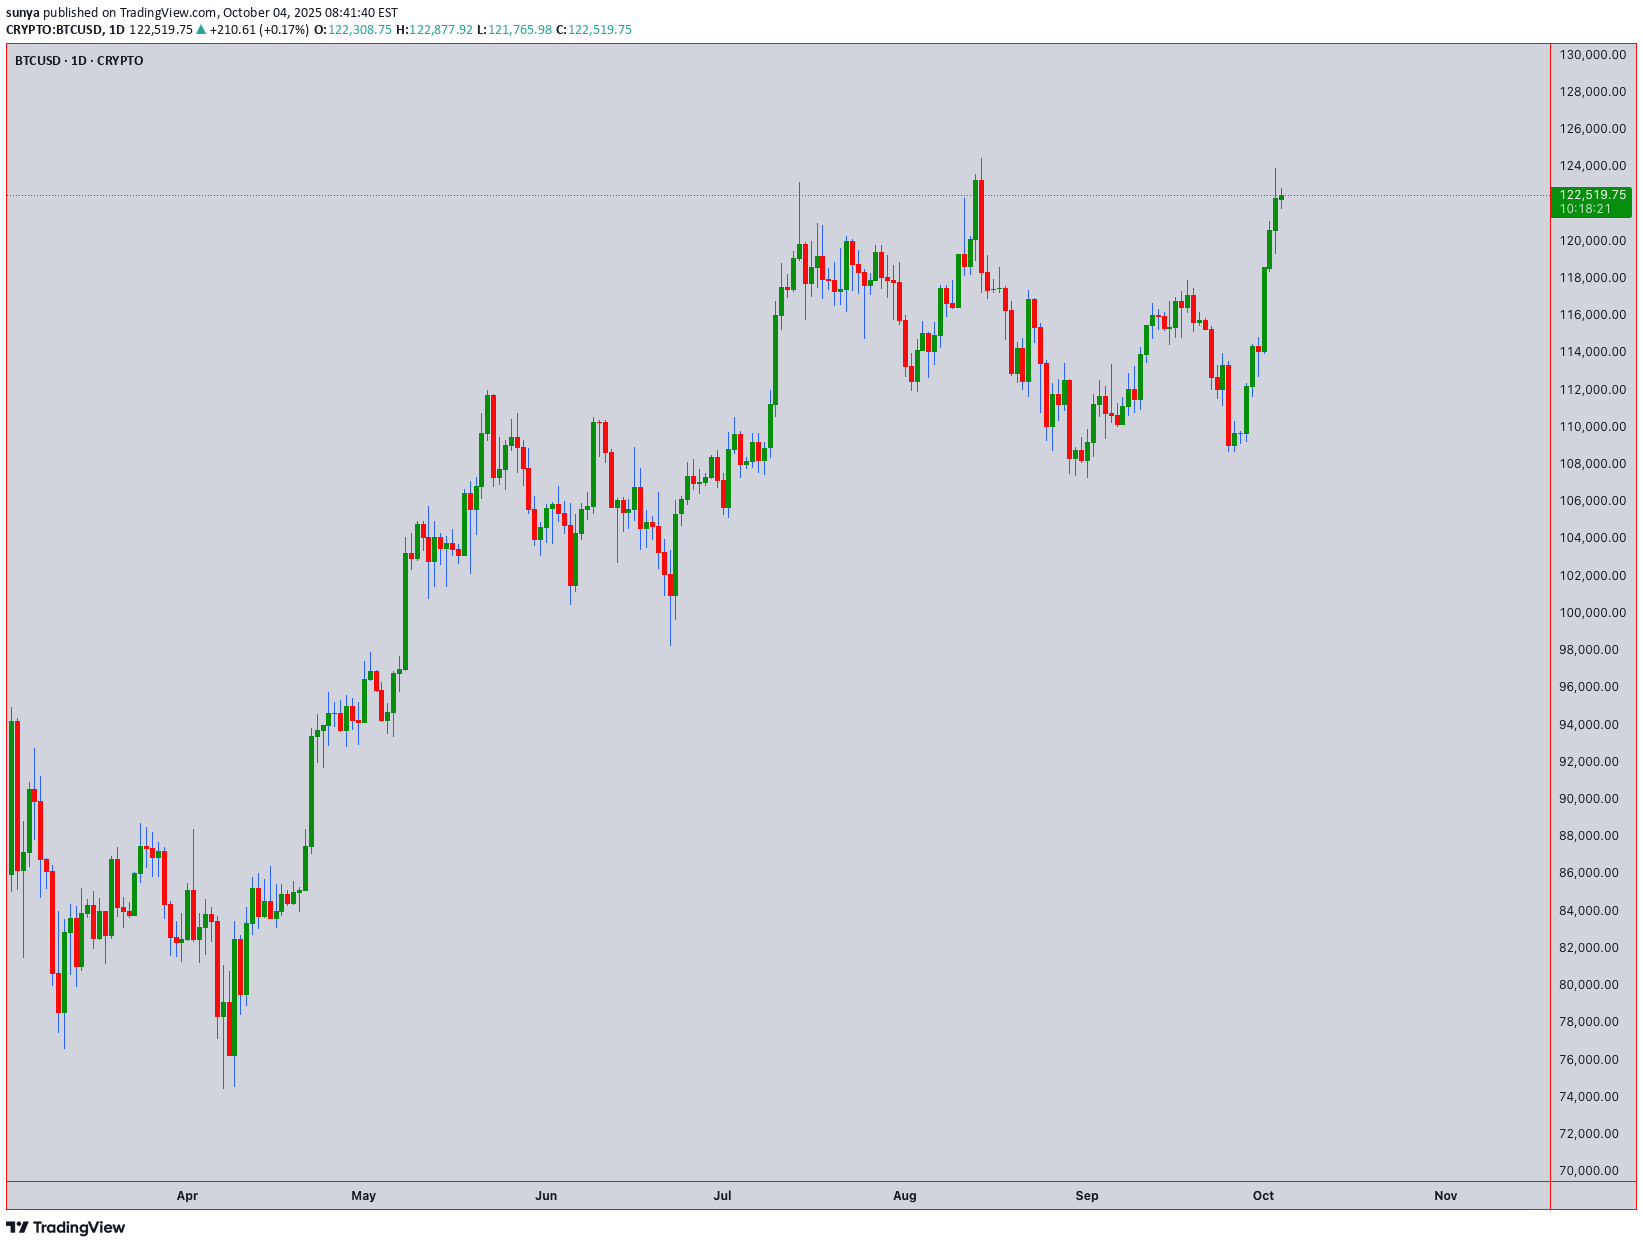
Asset: BTCUSD | Current Price: 122,491.82 | Analysis Date: [Current Date] | Timezone: UTC+4 🎯 Executive Summary & Market Context BTCUSD is trading at a formidable all-time high level near $122,500. This analysis examines whether this rally has the fuel to continue or if a significant correction is imminent. The confluence of several technical patterns and indicators suggests we are at a critical juncture. Geopolitical and macroeconomic factors, including institutional adoption and regulatory clarity, continue to provide a strong bullish undercurrent, but technical exhaustion signals are beginning to flash. 📊 Multi-Timeframe Technical Breakdown Swing Trading (4H, Daily, Weekly) - The Big Picture Primary Trend: Strongly Bullish on higher timeframes (Daily, Weekly). Key Pattern Confluence: Elliott Wave Theory: The rally from the last major swing low is best counted as a powerful Wave 3. We are now likely in a late-stage Wave 5 or a complex corrective Wave 4. A decisive break below the key support at $118,000 would signal that Wave 4 correction is underway, targeting the 0.382 Fibonacci level near $110,000. Wyckoff Theory: Analysis suggests we may be in a Re-Distribution phase. The sharp rise (Upthrust) is being tested. A failure to hold above $120,000 with decreasing volume could confirm this, leading to a Sign of Weakness (SOW). Ichimoku Cloud (Daily): The price is far above the Kumo (Cloud), indicating a strong trend but also signaling an overextended market. The Tenkan-sen (blue line) is acting as dynamic support near $119,500. A break below this would be the first sign of weakening momentum. Head and Shoulders? A potential, large-scale bearish Head and Shoulders top is tentatively forming, with the left shoulder around $115k, the head at this peak (~$123k), and a potential right shoulder to form. This pattern would only be confirmed by a break below the neckline, which would be projected around $105,000. Swing Trading Key Levels: Resistance (R1): 124,200 (Recent High) Resistance (R2): 127,500 (Psychological & Gann Angle) Support (S1): 119,500 (Ichimoku Tenkan-sen) Support (S2): 118,000 (Critical Wave 4 Invalidation) Support (S3): 110,000 (0.382 Fib & Major Swing Zone) Swing Trade Idea: Scenario A (Bullish Continuation): Wait for a pullback to the S1 ($119,500) or S2 ($118,000) support confluence with bullish reversal candlesticks (e.g., Hammer, Bullish Engulfing). Enter long with a stop loss below S2, targeting R1 and R2. Scenario B (Bearish Reversal): If price rejects R1 and breaks below S2 ($118,000) on high volume, consider a short position for a swing down towards S3 ($110,000), with a stop loss above R1. Intraday Trading (5M, 15M, 1H) - Precision Execution Intraday Bias: Neutral to Cautiously Bullish, but highly volatile. Be nimble. Key Indicators & Patterns: Anchored VWAP (from yesterday's low): The price is trading above the VWAP, indicating a Weak Bullish intraday trend. A break below the VWAP would shift the intraday bias to bearish, targeting the lower Bollinger Band. Bollinger Bands (20,2) on 1H: The price is hugging the upper band, suggesting sustained buying pressure but also overbought conditions. A move to the middle band (20 SMA) around $121,200 is a likely intraday pullback target. RSI (14) on 1H: Reading is near 65. It is not severely overbought (>70), but shows room for a minor correction before the next leg up. Candlestick Patterns: Watch for Bearish Engulfing or Evening Star patterns at the R1 resistance for short signals. Conversely, Bull Flags or Bullish Hammers near the VWAP or 20 SMA provide long entry signals. Intraday Key Levels: Resistance (R1): 123,000 (Psychological) Resistance (R2): 123,800 (Today's High) Support (S1): 121,800 (Current Session Low) Support (S2): 121,200 (1H 20 SMA / Bollinger Midline) Support (S3): 120,500 (VWAP & Strong Intraday Support) Intraday Trade Plan for the Session: Long Entry: On a bounce from S2 ($121,200) with a bullish candlestick confirmation. Target: $122,500 - $123,000. Stop Loss: 20 pips below entry. Short Entry: On a rejection at R2 ($123,800) with a bearish candlestick confirmation, or a break below the VWAP (S3). Target: S2 ($121,200). Stop Loss: 20 pips above entry or R2. ⚠️ Critical Risk Analysis: Trap Formations Bull Trap: A classic bull trap is set if the price makes a swift, low-volume spike above $124,200 (R1), luring in late bulls, before sharply reversing to close below $120,000. The Wyckoff Re-Distribution scenario aligns with this risk. Bear Trap: A bear trap occurs if the price wicks down sharply, breaking below $118,000 (S2) and triggering stop losses, only to reverse aggressively and reclaim that level, squeezing shorts and fueling the next leg up. This would invalidate the bearish Elliott Wave 4 count. 📈 Indicator Snapshot & Confluence ✅ Conclusion & Final Outlook Bullish Case: The trend is your friend. The price remains above all critical moving averages and the Ichimoku Tenkan-sen. A hold above $118,000 opens the path for a test of $127,500. Bearish Case: The market is overextended. The potential for an Elliott Wave 4 correction, a Wyckoff Re-Distribution, or a large-scale Head and Shoulders pattern presents significant downside risk towards $110,000. Trading Recommendation: For swing traders, the risk/reward favors waiting for a pullback to stronger support zones ($118k-$119.5k) before entering new long positions, or waiting for a confirmed break of support to play the short side. For intraday traders, trade the range between the key levels defined above, using the VWAP and Bollinger Bands as dynamic guides. Position sizing and strict stop-losses are non-negotiable at these elevated levels.