Technical analysis by CryptoNuclear about Symbol AVA: Buy recommendation (9/16/2025)

AVA/USDT —Demand Zone: Accumulation or Deeper Breakdown?
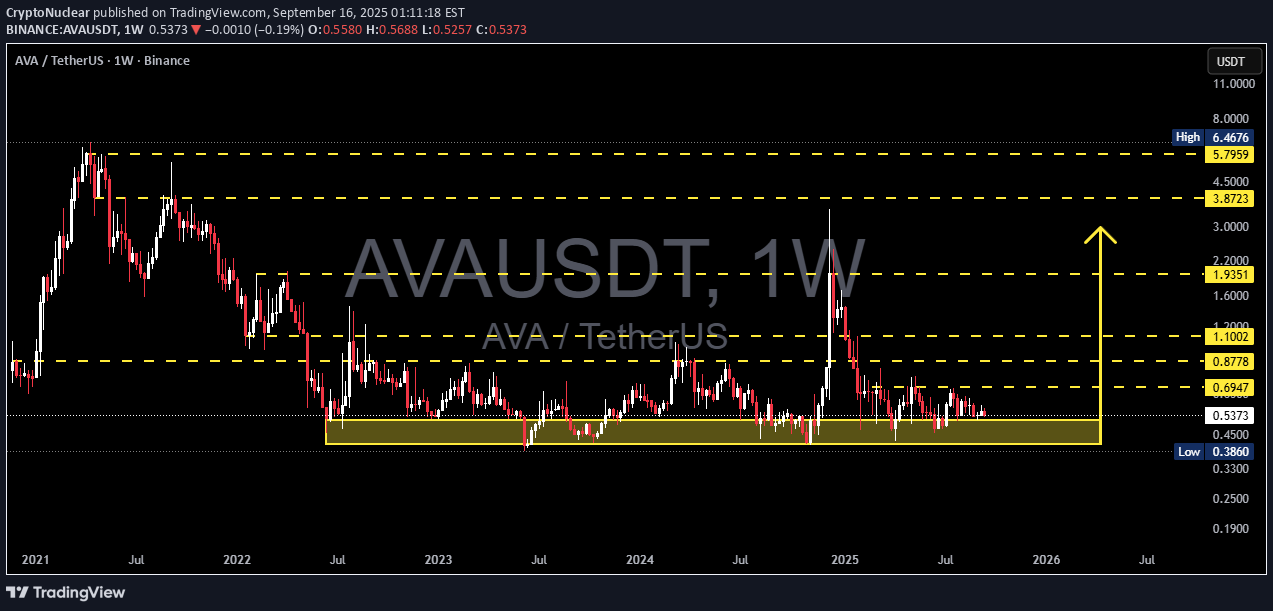
📌 Overview The AVA/USDT weekly chart shows a dramatic journey: From the 2021 peak ($6–7), price has been in a prolonged downtrend followed by sideways consolidation since 2022. For nearly 3 years, the yellow zone ($0.38 – $0.45) has acted as a battlefield between buyers and sellers. Each test of this area has resulted in strong rebounds, marking it as a major demand zone. Now, AVA is once again hovering near this critical support. The big question: Is this the ultimate long-term accumulation zone or the start of a deeper breakdown? --- 🔍 Pattern & Structure Analysis Macro trend: Bearish since 2021 → long consolidation from 2022–2025. Dominant pattern: Wide sideways range with a solid base at 0.38–0.45 and tiered resistances at 0.69, 0.87, 1.10, 1.93. Price character: Multiple lower wicks into demand zone → sign of liquidity grabs and potential accumulation by bigger players. Prolonged sideways near lows suggests a possible bottoming formation. However, compression against support can also lead to a breakdown if bulls lose control. --- 🟢 Bullish Scenario If buyers defend 0.38–0.45 and push higher: 1. First confirmation: Weekly close above 0.6947. 2. Upside targets: 0.8778 → first mid-term resistance. 1.1002 → psychological & structural breakout zone. 1.9351 → major resistance, early trend reversal confirmation. 3. With strong momentum, a revisit of 3.87 – 5.79 (the 2021 supply zone) remains possible in the next bull cycle. (Potential gains: +63% to 0.87 / +105% to 1.10 from current price ~0.53). --- 🔴 Bearish Scenario If a strong weekly close below 0.386 occurs: 1. The 3-year demand zone will fail → showing buyers have lost control. 2. Downside target: 0.25 – 0.19 as the next realistic demand area. 3. Extreme measured-move projection even points to 0.07 (though unlikely, it must be considered). (Downside risk: −53% to 0.25 from current price). --- 📊 Key Takeaways $0.38–0.45 = pivotal demand zone for AVA’s next cycle. Breakout above 0.69 = early bullish signal. Breakdown below 0.38 = opens risk of new all-time lows. This zone will decide whether AVA enters a new accumulation phase or faces final capitulation. --- Critical demand zone = 0.38–0.45. Watch 0.6947 breakout for bullish bias. Watch 0.386 breakdown for bearish continuation. Momentum will reveal if this is smart money accumulation or a last leg down. --- #AVA #AVAUSDT #CryptoAnalysis #WeeklyChart #Altcoins #TechnicalAnalysis #SupportResistance #CryptoTrading #ChartPatterns