Technical analysis by CryptoNuclear about Symbol CFX: Buy recommendation (9/15/2025)

CryptoNuclear
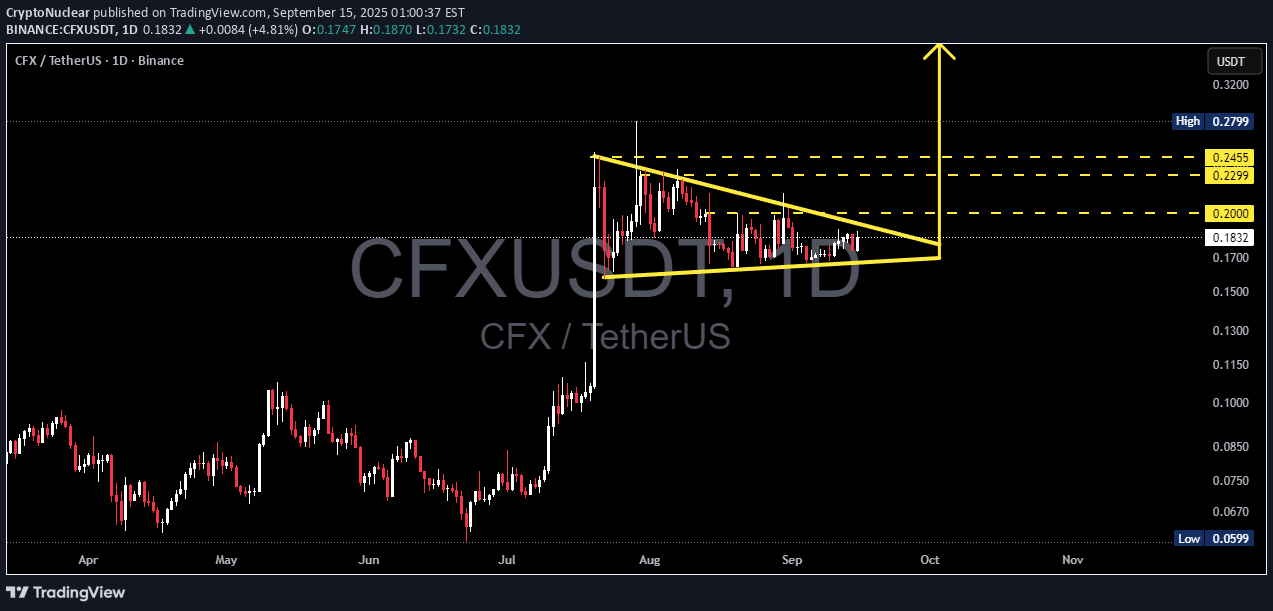
📝 Full Analysis & Narrative CFX/USDT is currently forming a symmetrical triangle pattern on the daily timeframe after experiencing a strong rally in July–August. This pattern is characterized by a series of lower highs (descending upper trendline) and higher lows (ascending lower trendline), gradually converging into an apex — a classic sign of consolidation with decreasing volatility. Typically, a symmetrical triangle after a strong impulse tends to act as a continuation pattern, meaning that the price has a higher probability of resuming the prior trend (in this case, bullish). However, we must also acknowledge the possibility of a breakdown if market sentiment turns bearish. --- 🔼 Bullish Scenario If the price manages to break above the upper trendline with a valid daily close supported by high volume, it will likely confirm a continuation of the bullish move. Short-term targets: $0.2000 → psychological and immediate resistance. $0.2299 → horizontal resistance zone. $0.2455 → key resistance before retesting previous highs. Extended target (measured move): Based on the triangle’s height (~$0.125), a confirmed breakout around $0.2000 projects a potential target near $0.3250, which would exceed the previous high at $0.2799. Entry strategy: Conservative: wait for breakout + retest of the upper trendline turned into support. Aggressive: partial entry before the breakout near the apex (higher risk of fakeouts). --- 🔽 Bearish Scenario If the price fails to hold and breaks below the lower trendline, bearish momentum could take control. Short-term targets: $0.1700 → immediate support. $0.1550 → lower boundary of the triangle. Extended target: If selling pressure accelerates, price could drop toward $0.1000, or even revisit $0.0599 (the historical low shown on the chart). Entry strategy: Wait for a confirmed daily close below the lower trendline with strong volume. Place stop-loss above the broken trendline or near the latest swing high. --- 🔍 Key Factors to Watch 1. Volume is critical → breakouts without volume often lead to fake moves. 2. Daily close confirmation matters more than intraday wicks. 3. Retests of broken trendlines often offer better risk/reward setups. 4. Risk management is essential: keep SL levels clear and limit position size (risk 1–2% per trade). --- 📊 Conclusion CFX/USDT is approaching a decisive moment. The symmetrical triangle indicates that the market is in “waiting mode” before making its next major move. A breakout above could ignite a continuation rally toward $0.20 → $0.2455 and potentially $0.3250. On the other hand, a breakdown could open the door for a correction back to $0.155 or even $0.10. Traders should wait for confirmation of direction and maintain strict risk management discipline. --- #CFX #CFXUSDT #CryptoAnalysis #TrianglePattern #BreakoutOrBreakdown #CryptoTrading #Altcoins #ChartAnalysis #RiskManagement
