Technical analysis by CryptoNuclear about Symbol IOTA: Buy recommendation (9/13/2025)

CryptoNuclear
IOTA/USDT — the Crossroads: Major Breakout or Deeper Breakdown?
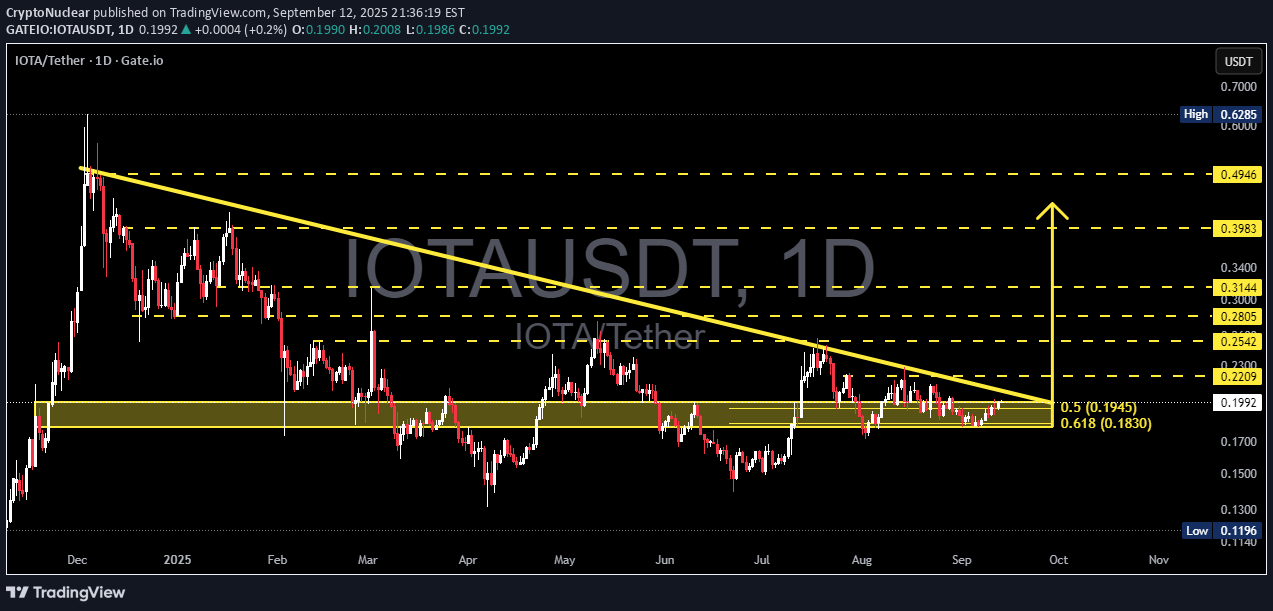
📌 Overview The daily chart of IOTA is reaching a critical decision point. After months of being pressured by a long-term descending trendline, the price still manages to hold above the demand zone at 0.183 – 0.195 USDT (a confluence of the 0.618 & 0.5 Fibonacci retracements). This structure has formed a descending triangle / falling wedge, which tells us: Buyers are consistently defending the demand zone. Sellers are pushing with lower highs, squeezing the price tighter and tighter. This creates a classic “make or break” setup — either IOTA breaks out with momentum or breaks down into lower levels. --- 📊 Technical Structure & Pattern Main Pattern: Descending triangle / falling wedge. Dynamic Resistance: Downtrend line (~0.22–0.225). Key Support / Demand Zone: 0.183 – 0.195 USDT (Fibo 0.618 & 0.5). Upside Targets if Breakout: 0.254 → 0.280 → 0.314 → 0.398 → 0.495. Downside Targets if Breakdown: 0.15 → 0.13 → 0.1196 (historical low). --- 🚀 Bullish Scenario 1. Confirmation: Daily close above 0.22–0.225 (trendline breakout). 2. Why it matters: A breakout would signal the end of the multi-month downtrend and attract new buying momentum. 3. Targets: First target: 0.2542 USDT. Next zones: 0.2805 – 0.3144. Strong breakout momentum could extend toward 0.398 – 0.495. 4. Stop-loss: Below 0.183 support cluster. Bullish narrative: If buyers manage to break the descending wall, IOTA could enter a new trend reversal phase, pulling fresh interest from sidelined investors. --- 📉 Bearish Scenario 1. Confirmation: Daily close below 0.183 with strong volume. 2. Why it matters: This would signal that demand has collapsed, giving sellers full control. 3. Targets: First target: 0.15 – 0.13 USDT. Extended target: 0.1196 USDT (historical low). 4. Stop-loss: Above 0.195–0.22 depending on entry. Bearish narrative: A breakdown here could trigger a capitulation phase, sending IOTA into deeper lows before a new base is found. --- 🔑 Why This Chart is Important Confluence Zone: Trendline resistance + Fibonacci retracement + demand zone converge at the same area. High Probability Setup: Either direction, the move is likely to be strong. Clear Risk/Reward: Levels are well defined, giving traders precise setups. Daily Close + Volume = Key: No confirmation means high risk of false breakouts. --- 📌 Conclusion IOTA is at a technical crossroads: Bullish case: Breakout >0.22 could lead to 0.254 → 0.314+. Bearish case: Breakdown <0.183 could lead to 0.15 → 0.1196. 👉 Traders should wait for daily close confirmation with volume before committing to big positions. 👉 Investors should watch closely — this zone will determine whether IOTA starts a reversal or extends its downtrend. --- #IOTA #IOTAUSDT #Crypto #TechnicalAnalysis #ChartAnalysis #PriceAction #Breakout #SupportResistance #Fibonacci #CryptoTrading #Altcoins