Technical analysis by Bozwolf about Symbol TRUMP: Buy recommendation (9/5/2025)

Bozwolf
TRUMP/USDT – Daily Chart Positive Divergence Analysis
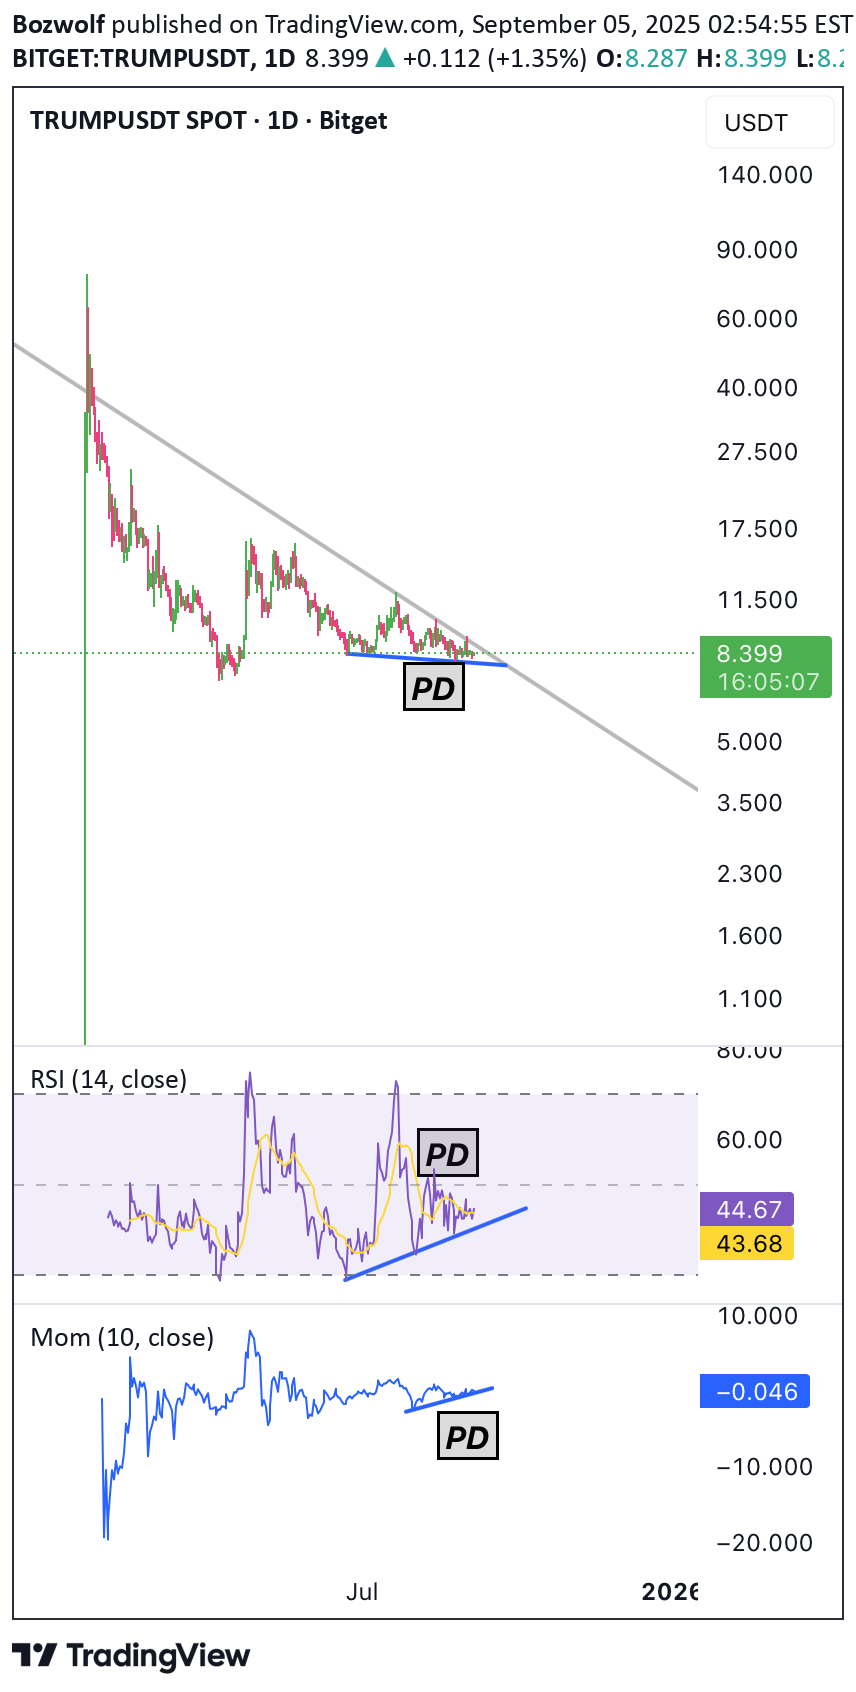
The most notable feature on the chart is the descending triangle formation where the price is consolidating while showing strong bullish divergences across multiple indicators. 🔹 Price Action: The price keeps making lower lows but finds solid support around the 8 USDT zone, holding near the bottom of the triangle. 🔹 RSI (14): While the price trends lower, RSI is forming higher lows. This signals weakening selling pressure and growing strength from buyers. 🔹 Momentum (Mom 10): The Momentum indicator also prints higher lows against the lower price action. This confirms that bearish momentum is fading and increases the probability of an upside breakout. ⚡ Summary: As the price approaches the apex of the triangle, both RSI and Momentum show strong bullish divergences. This setup may anticipate an upside breakout. A sustained move above 10 USDT could open targets around 13 – 17 – 23 USDT levels.