Technical analysis by tradecitypro about Symbol HYPE on 9/4/2025

tradecitypro
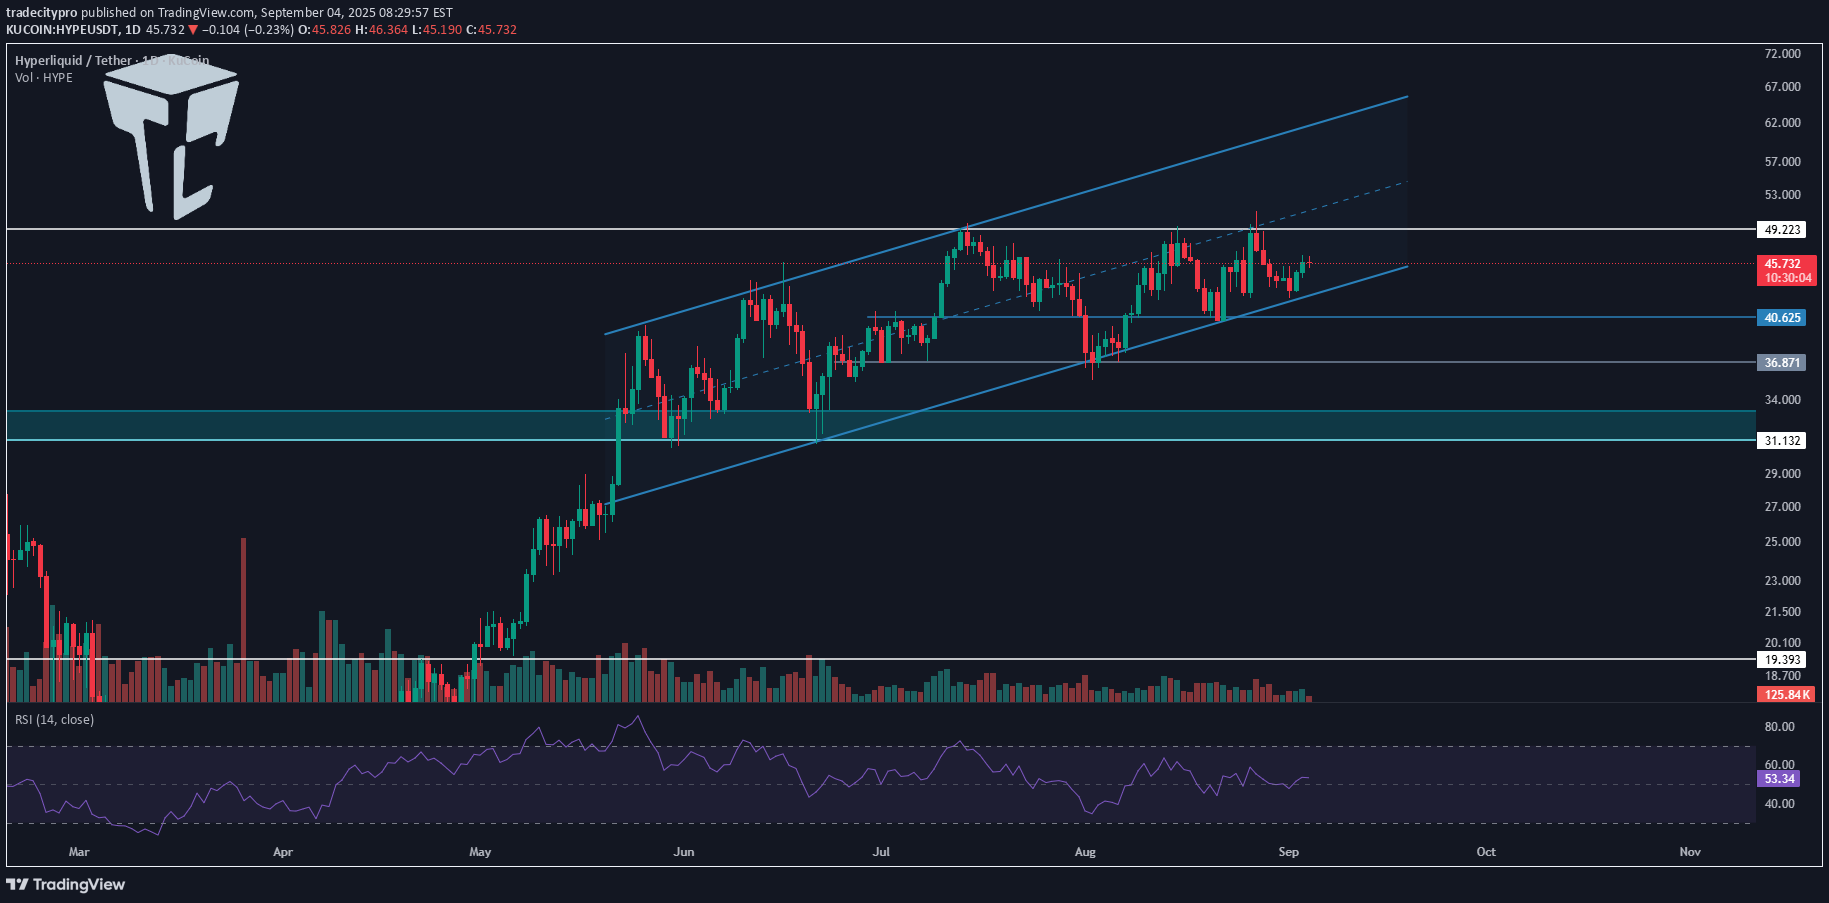
👋 Welcome to TradeCity Pro! In this analysis, I want to review the HYPE coin for you. It is one of the coins that has recently trended and with a market cap of 15.31 billion dollars is ranked 12th on CoinMarketCap. 📅 Daily Timeframe In the daily timeframe, this coin has had a very long-term upward trend that has now shown weakness after breaking the 31.132 zone, and its slope has decreased significantly. ✨ After the 31.132 break, an ascending channel has formed, and the price is correcting in the direction of the trend. 📊 The volume has gradually decreased, indicating weakness in this upward move, and on the other hand, RSI has shown a strong divergence. 💥 Of course, the RSI divergence has not yet been activated, and it is natural for RSI to show divergence when the price is in a correction and consolidation phase. ✅ Currently, the price is in the lower half of the channel and has reacted several times to the bottom and midline of the channel. If the resistance at 49.223 is broken, the price structure can change, and if volume starts to increase, the probability of breaking the channel top rises significantly. ⚡️ On the other hand, considering all the negative signs that have led to this trend weakness, the possibility of breaking the channel to the downside is also high. 📈 In that case, with the break of the 40.625 or 36.871 triggers, we can open a short position, but in my opinion, as long as the price is above the 31.132 zone, short positions are not logical and the market trend remains bullish. 📝 Final Thoughts Stay calm, trade wisely, and let's capture the market's best opportunities! This analysis reflects our opinions and is not financial advice. Share your thoughts in the comments, and don’t forget to share this analysis with your friends! ❤️
