Technical analysis by FX_Gold_Mastermind about Symbol PAXG: Buy recommendation (8/31/2025)

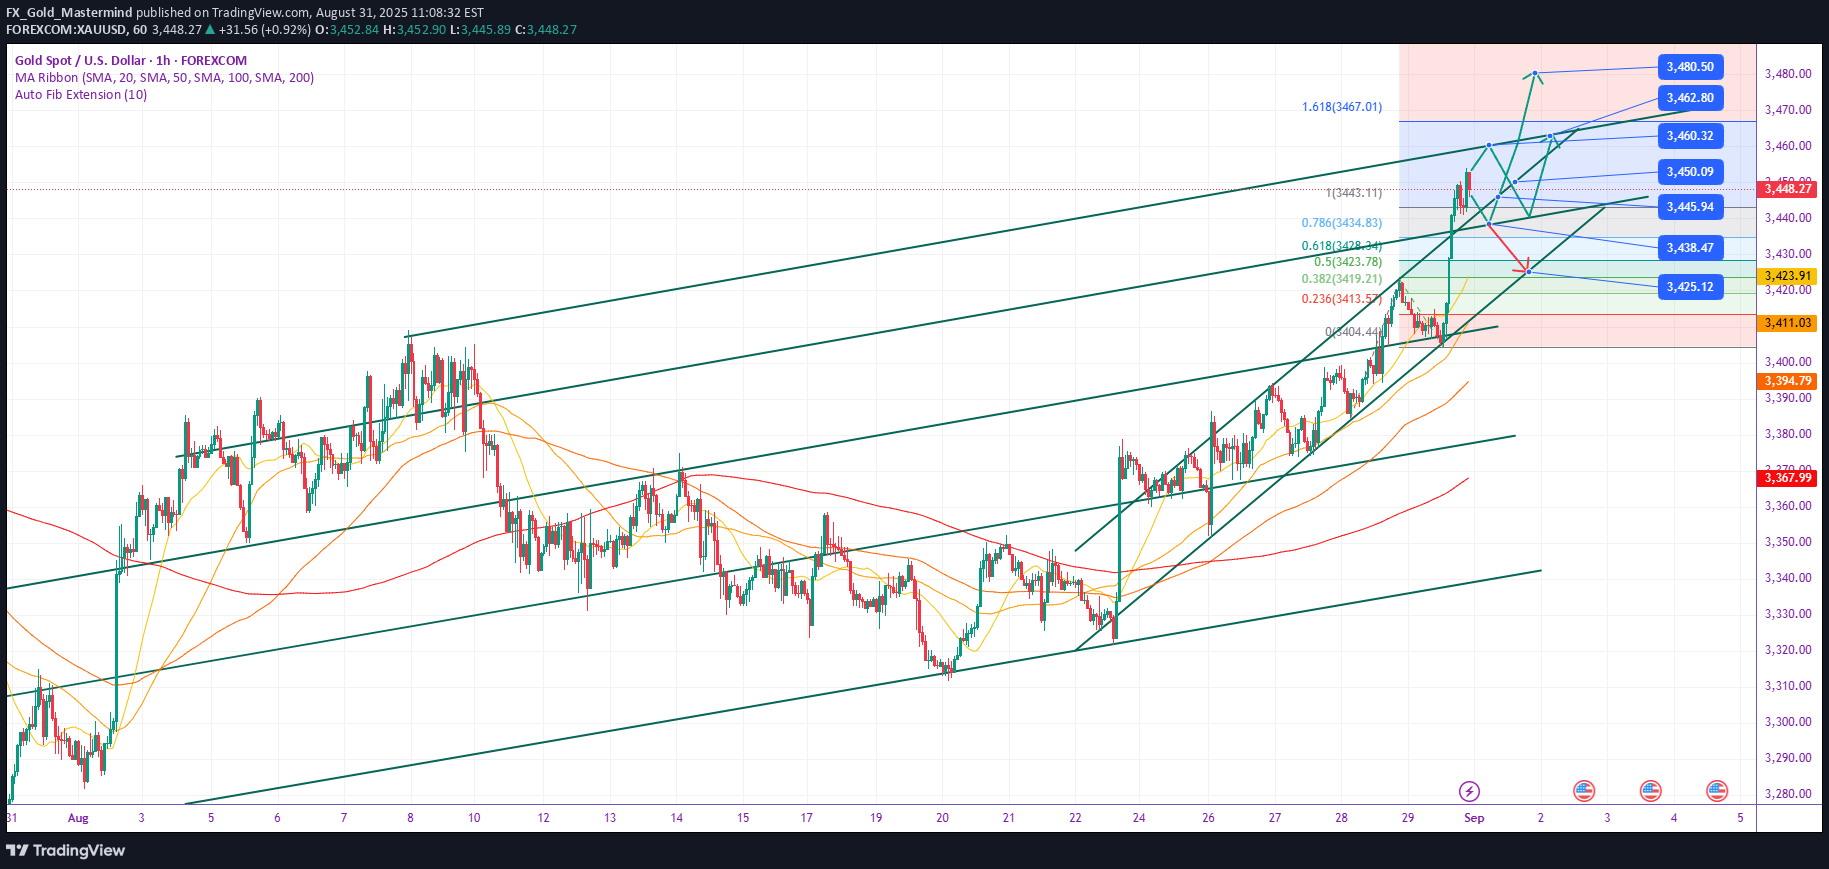
🏅 Gold Market Trend Analysis and Outlook for Next Week 1. Gold News Analysis The July US PCE data showed that core inflation rose from 2.8% to 2.9% year-on-year, slightly exceeding market expectations. The reason why this data is important is that it is one of the inflation indicators that the Federal Reserve values most, and its performance will greatly affect the Federal Reserve's decision at its monetary policy meeting in September. After the data was released, spot gold prices briefly rose and then continued to rise, reaching a high of $3,440 per ounce, reflecting the market's complex interpretation of inflation data and uncertainty about future monetary policy. Expectations of a Fed rate cut are currently the primary market driver. According to the Chicago Mercantile Exchange's FedWatch tool, traders currently price in an 85%+ probability of a 25 basis point rate cut at the Fed's September meeting. Historical experience shows that a low interest rate environment will reduce the opportunity cost of holding interest-free gold while putting pressure on the US dollar, which is a double benefit for gold. Political uncertainty also provided support for gold prices. President Trump's attempt to fire Federal Reserve Governor Tim Cook has raised market concerns about the Fed's independence. Cook subsequently filed a lawsuit, arguing that the president had no authority to remove him from office. Such political uncertainty typically increases gold's safe-haven appeal. In terms of the US dollar trend, the US dollar index has continued to weaken recently, which makes gold denominated in US dollars cheaper for overseas buyers, thereby stimulating international demand. New York Fed President John Williams's hints at a possible interest rate cut further reinforced market expectations of a weaker dollar. 2. Gold Technical Analysis Key Support and Resistance Levels: Key Support: The 3400-3405 area is a key support band. If it holds above this level, the bullish and volatile upward trend is likely to continue. Short-term support below is the 3410-3415 area. Key Resistance: Short-term resistance above is initially at $3452 (the June 16 high). A strong break above this level could potentially challenge the $3500 mark. Technical Indicator Signals: The Relative Strength Index (RSI) suggests that buyers are gaining momentum, supporting further upward movement in gold prices. 3. Trading Strategy Recommendations Based on the above analysis, the short-term trading strategy for gold next week should primarily focus on long positions on pullbacks, supplemented by short positions on rebounds. Specific Trading Strategies: Long Strategy: When gold pulls back to the 3430-3420 support area, consider buying long positions in batches (buy long), setting a stop-loss below 3418, and targeting the 3440-3450 area. A breakout could target the 3460-3470 area. Short Strategy: When gold rebounds to the 3460-3470 resistance area, consider shorting positions (buy short), Set stop loss above 3475, and targeting the 3440-3430 area. A breakout could target the 3420-3410 area. Risk Control: Maintain good position management and stop-loss orders. Set stop-loss orders strictly and avoid holding onto positions. Pay close attention to changes in market news, especially before and after the release of non-farm payroll data, as market volatility may increase. 5. Summary and Medium- to Long-Term Outlook Overall, gold prices are likely to fluctuate first before determining a new direction next week. In the first half of the week, it will likely fluctuate primarily between 3420 and 3460, awaiting guidance from the non-farm payroll data. In the second half of the week, a breakout direction may be determined based on the data.Key Points from the September 1 Gold Market Trend Analysis: 📈 Current Market Status: Price Performance: Spot gold rallied strongly, reaching a high of $3,489/oz during the European trading session, approaching the crucial $3,500 historical psychological level. Market Sentiment: Bullish sentiment persisted, with both the weekly and monthly charts posting strong bullish candles, setting new all-time closing highs and demonstrating that bulls were in full control. 🧩 Key Drivers of the Rise Expectations of a Fed Rate Cut: This was the most critical driver. Market consensus is that the Fed will begin its rate cut cycle in September, putting pressure on the US dollar and significantly increasing gold's appeal. Geopolitical Risk: International tensions (e.g., in the Middle East and Eastern Europe) have fueled significant safe-haven demand, with funds pouring into gold seeking refuge. Technical Breakthrough: Gold prices successfully broke through a series of key resistance levels, including 3,420-3,430, with a surge in technical buying, creating a virtuous cycle of breakouts and gains. 📊 Technical Analysis: Key Price Levels at a Glance The following clearly illustrates the current market's bullish and bearish watersheds and target levels: ⚔️ Short-term resistance: 3490-3500 immediate resistance, representing historical highs. A break above this level will open up further upside potential. Medium-term: 3530-3580 bullish target and potential profit-taking zone after a break above 3500. 🛡️ Support: Short-term support: 3460-3450 immediate support, crucial for maintaining intraday gains. Key support: 3440 is the bullish lifeline. A break below this level signals a short-term peak and the beginning of a deeper correction. 🎯 Trading Strategy Recommendations: Primary Strategy (Buy on Pullbacks): In the current bullish market, following the trend is the preferred strategy. It is recommended to establish long orders in batches when the gold price pulls back to the 3460-3450 support area, and set the stop loss below 3440. Secondary strategy (breakthrough and long): If the gold price breaks through and stabilizes at the $3,500 mark, you can consider lightly buying with the trend, targeting $3,530. Cautious Strategy (Short on a Rebound): This counter-trend strategy carries a higher risk and is only suitable for experienced traders. A small position can be used to test the waters when the price first reaches the 3,490-3,500 area and shows clear signs of resistance (such as a long upper shadow). Set a strict stop-loss. Important Note: The market has already priced in numerous interest rate cut expectations, and technical indicators suggest short-term overbought conditions. Market volatility may intensify ahead of the release of major data (non-farm payrolls). Be sure to operate with a light position, strictly set stop-loss, and guard against the "black swan" risk caused by data results not meeting expectations.Will gold break through $3,500 on September 2nd? I. Core Fundamental Drivers Expectations of a Fed Rate Cut Strengthen: Market expectations for a September Fed rate cut have risen to over 87%. Fed Chairman Powell has previously signaled a dovish stance, suggesting an openness to a rate cut. If the interest rate cut is implemented, it will weaken the attractiveness of the US dollar, reduce the opportunity cost of holding gold, and be good for gold prices. Safe-haven demand surges: The dismissal of a Federal Reserve governor has raised questions about the Fed's independence and weakened confidence in US dollar assets. Geopolitical tensions and continued global economic uncertainty (such as tariff policies and recession concerns) have driven funds into gold as a safe haven. II. Key Technical Levels Current Price: Spot gold is trading around $3,475 (yesterday's high of $3,489), approaching the historically important $3,500 level. Support Levels: Major support: $3,460-3,450 (short-term strength/weakness dividing line). Key Support: $3440 (recent low, trend-sustaining lifeline). Resistance: Near-term resistance: $3490-3500 (historical high breakout level). Targets after a breakout: $3530, $3580 (bullish extension targets). Technical Pattern: The daily chart is at the end of a converging triangle and has broken upwards. Both the weekly and monthly charts closed with large bullish candles, indicating strong bullish momentum. III. Short-Term Trading Strategy Long Strategy: Entry Time: Go long after a pullback to the 3460-3450 area and stabilization (conservative traders can arrange long orders in batches). Stop loss setting: below $3440 (if it falls below this level, the trend will weaken). Target Range: $3490-3500 (hold for a target of $3530+ after a breakout). Short Strategy: Participate with a light position only when a rebound encounters resistance: Short sell after a stagflation signal appears in the 3490-3500 area. Stop loss setting: above $3505. Target range: $3470-3460 (quick entry and exit, betting on technical pullbacks). Buy on breakouts: If the price breaks through the $3500 level, you can buy with a small position, targeting $3530-3550. IV. Risk Warning Historical seasonality: Over the past 10 years, the probability of a gold price decline in September has been 70%. Be wary of "good news exhaustion" and technical false breakouts. Position Management: Limit risk per trade to 2%-5% of total capital, and avoid buying heavily at high levels. If expectations of a Fed rate cut reverse or geopolitical risks ease, gold prices could face a deep correction. Summary: The short-term bullish trend remains unchanged. The operation is mainly to go long on pullbacks, with a focus on the breakthrough of the 3460-3450 support and the 3500 mark. Be cautious and strictly control risks before the release of non-farm data.
