Technical analysis by CryptoNuclear about Symbol KDA: Buy recommendation (8/28/2025)

CryptoNuclear
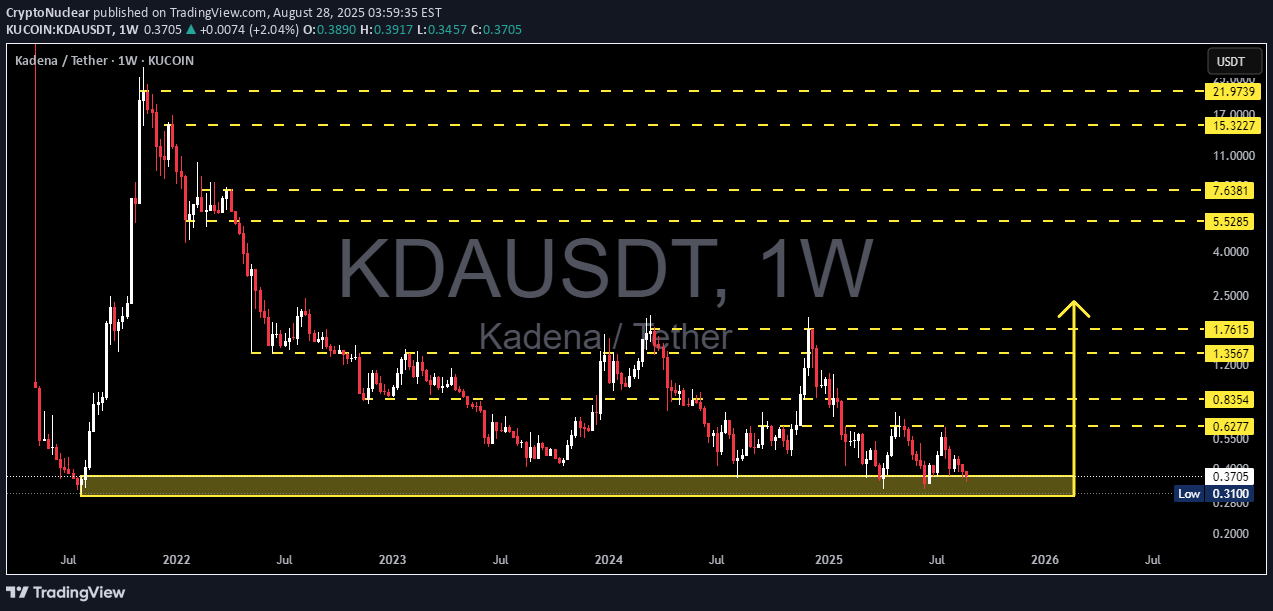
🧩 Big Picture Kadena (KDA) is still trapped in a long-term consolidation phase after its sharp decline from the 2021 peak. Currently, price is holding at the 0.31–0.42 USDT support zone, which has acted as a “last fortress” for buyers for over 3 years. The structure is intriguing: despite the dominant macro downtrend (a series of lower highs), this yellow zone has consistently rejected breakdowns. This suggests silent accumulation from long-term market participants. --- 🔍 Pattern & Price Structure Key support: 0.31–0.42 (yellow box) → tested multiple times since 2022. Extended sideways: market in a narrow range, signaling a phase of capitulation → distribution → accumulation. Supply zones (resistance): 0.6277 → 0.8354 → 1.3567. Momentum: though weak, repeated wicks near 0.31 show buyers still defending the level. In short, KDA now sits at a psychological pivot between survival and collapse. --- 🚀 Bullish Scenario If demand remains strong, a mid-term reversal could emerge: 1. Initial rebound: weekly close above 0.42 → potential rally toward 0.6277 → 0.8354. 2. Reversal confirmation: weekly close above 0.8354 with rising volume → targets 1.3567 → 1.7615. 3. Extended targets: if broader crypto sentiment improves, a recovery toward 5.5285 → 7.6381 is possible. 👉 Bullish Key: KDA must reclaim and hold above 0.6277 to “come back to life.” --- 🩸 Bearish Scenario If buyers fail to hold 0.31, the consequences are severe: 1. Strong breakdown: weekly close below 0.31 → opens the door toward 0.20 or even 0.10 (no strong historical support). 2. Retest as resistance: once broken, 0.31–0.42 flips into distribution zone → sellers gain control. 3. Market psychology: losing this support could trigger panic selling, as it’s been the foundation since 2022. 👉 Bearish Key: Safe as long as 0.31 holds. If it breaks, expect continuation of the bearish trend. --- 📌 Key Levels Major support: 0.31 – 0.42 Near resistances: 0.6277 → 0.8354 → 1.3567 → 1.7615 Bullish targets: 5.5285 → 7.6381 → 15.3227 → 21.9739 Breakdown zone: 0.20 → 0.10 --- 🎯 Extra Insight The yellow zone = “the battleground of long-term investors.” Current pattern resembles an extended bottoming phase → could be a golden accumulation opportunity, or a trap if support collapses. Best described as: “accumulation or annihilation.” Waiting for a weekly confirmation is crucial to avoid false breakouts or breakdowns. --- 📢 Conclusion KDA/USDT is at a critical balance point. Bullish case: breakout above 0.6277 opens the path to 0.8354–1.3567. Bearish case: breakdown below 0.31 risks further decline to 0.20–0.10. 📌 For investors: this zone may offer high-risk accumulation with high potential reward. 📌 For traders: watch 0.31 support and 0.6277 resistance for entry/exit signals. #KDA #KDAUSDT #Kadena #CryptoAnalysis #PriceAction #SupportResistance #Altcoins #CryptoSignals #TechnicalAnalysis
