Technical analysis by CryptoNuclear about Symbol ORCA: Buy recommendation (8/24/2025)

CryptoNuclear
ORCA/USDT — Symmetrical Triangle Apex: The Calm Before the Storm
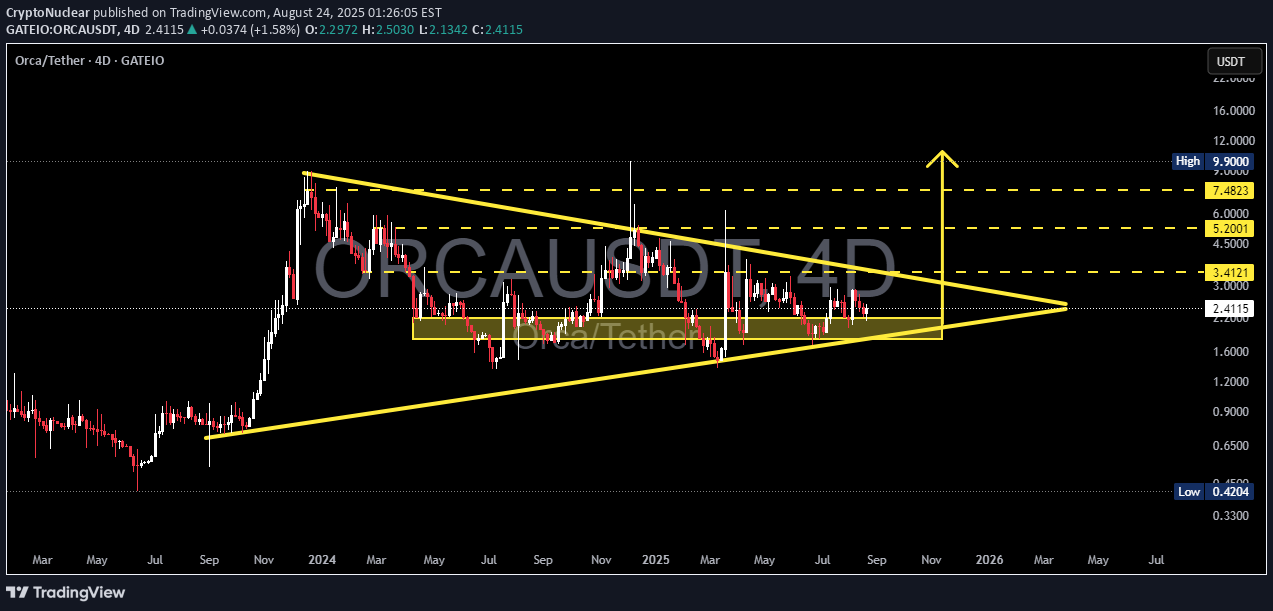
🔎 Chart Overview ORCA/USDT has been forming a massive Symmetrical Triangle since early 2024. The pattern is defined by lower highs (gradual selling pressure) and higher lows (steady accumulation by buyers). This represents a phase of tight consolidation, and as the price approaches the apex, the probability of a strong impulsive move ahead increases dramatically. Currently, the price trades around 2.41 USDT, right inside the demand zone at 2.3 – 2.6 (yellow box). This zone has acted as a critical support multiple times since 2024, making it the key battleground for the next directional move. --- 🔼 Bullish Scenario (Breakout) Trigger: A confirmed 4D candle close above the descending trendline and reclaim of the 3.00 – 3.41 USDT zone. Confirmation: A breakout accompanied by rising volume would signal strong bullish momentum. Upside Targets: 🎯 3.41 (first key resistance) 🎯 5.20 (psychological level) 🎯 7.48 (historical resistance) 🎯 9.90 (ATH / ultimate mid-term target) Invalidation: A breakdown and 4D close below 2.3 USDT would invalidate the bullish setup. --- 🔽 Bearish Scenario (Breakdown) Trigger: A breakdown below the 2.3 – 2.6 demand zone and loss of the ascending trendline support. Downside Targets: 🛑 1.60 🛑 0.90 🛑 0.42 (historical Low) if capitulation unfolds. Invalidation: A swift reclaim above 2.3 – 2.6 and re-entry into the triangle structure. --- 📌 Pattern Implications The Symmetrical Triangle is a neutral pattern, but once a breakout occurs near the apex, it often leads to powerful trending moves. The closer the price gets to the apex, the less time remains before volatility spikes. Volume expansion will be the most reliable confirmation to separate a genuine breakout from a fakeout. --- 🎯 Extra Insight The 2.3 – 2.6 demand zone is more than just support — it’s a strategic accumulation area where buyers have consistently defended their ground. Holding this zone and breaking the descending resistance could trigger a multi-month rally. Conversely, losing this zone could push ORCA into a capitulation phase before the next major cycle begins. #ORCA #ORCAUSDT #Crypto #Altcoins #Breakout #PriceAction #TrianglePattern #TechnicalAnalysis #BullishScenario #BearishScenario