Technical analysis by CryptoNuclear about Symbol INJ: Buy recommendation (8/22/2025)

CryptoNuclear
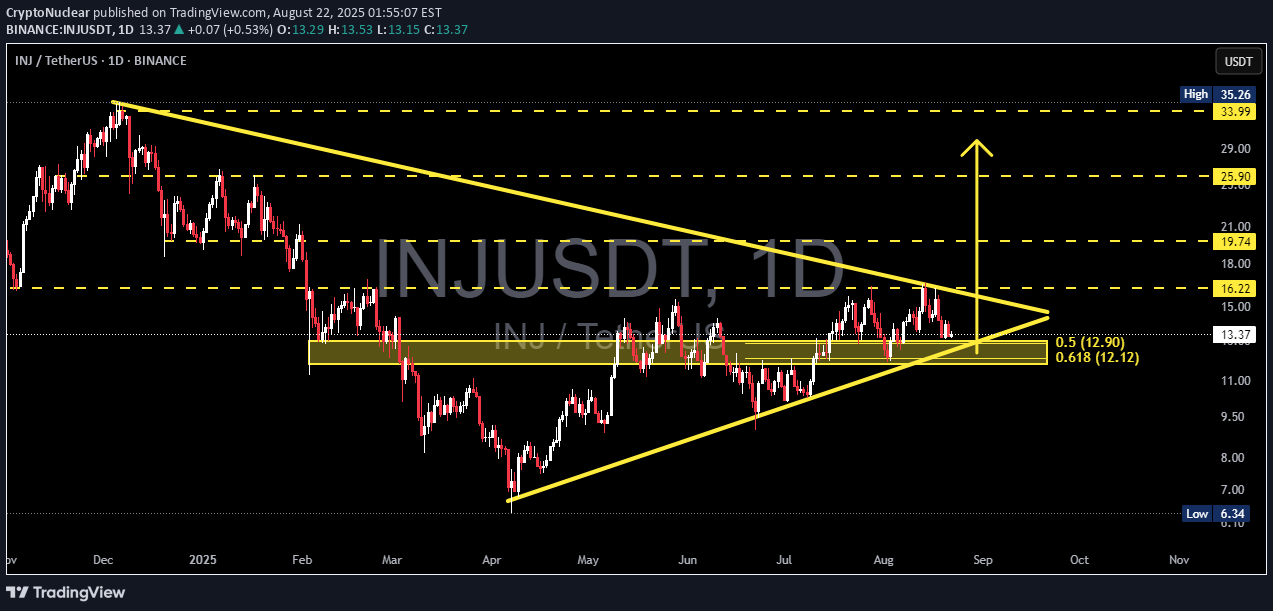
Full Analysis: INJ/USDT is currently consolidating within a daily symmetrical triangle pattern, where lower highs (seller pressure) meet higher lows (buyer defense). This pattern usually signals a phase of compression before a strong directional breakout, typically occurring as price approaches the apex of the triangle. Right now, price sits around 13.35, testing a critical demand zone that overlaps with the 0.5–0.618 Fibonacci retracement (12.90–12.12). This makes the zone a make-or-break area: holding above could fuel a bullish breakout, while a breakdown would likely trigger further bearish momentum. --- 🔼 Bullish Scenario Trigger: A daily close above the triangle’s upper trendline (~15.0), followed by a confirmed breakout above 16.22. Additional Confirmation: Increasing volume during breakout. Upside Targets: 🎯 T1: 16.22 → confirmation of breakout. 🎯 T2: 19.74 (key historical resistance). 🎯 T3: 25.90 (next major resistance). 🎯 T4: 33.99–35.26 (previous high & ultimate bullish objective). Invalidation: Failure to hold above 16.22 after breakout and a return back inside the triangle. --- 🔽 Bearish Scenario Trigger: A daily close below the ascending trendline and the 12.90–12.12 demand zone. Additional Confirmation: Strong selling volume and clear rejection candles below the zone. Downside Targets: ⚠️ T1: 9.50 (psychological support & measured move projection). ⚠️ T2: 6.34 (major historical low). Invalidation: Quick recovery and reclaim above 12.9–13.5. --- 📐 Pattern & Technical Logic Symmetrical Triangle → Neutral structure, representing market indecision before a strong move. Measured Move Projection → Height of the triangle (~3–4 points) projected from the breakout point → aligns with ~19.7 to the upside or ~9.5 to the downside. Golden Fibonacci Zone (0.5–0.618 / 12.90–12.12) → Often acts as the last stronghold for buyers in a mid-term structure. --- 📝 Key Insight If INJ manages to break and sustain above 16.22 with strong volume, it could trigger a major bullish continuation toward higher targets. Conversely, a decisive breakdown below 12.12 would confirm bearish momentum, opening the door for a deeper retracement toward 9.50 and 6.34. With volatility squeezing near the apex, a large directional move is very likely in the coming weeks. --- 🎯 Conclusion INJ is approaching a critical decision point: Above 16.22 = bullish breakout with significant upside potential. Below 12.12 = bearish breakdown with deeper correction ahead. Traders should wait for a confirmed daily breakout before committing to a direction. Whichever side wins, the risk/reward opportunity is substantial. #INJ #INJUSDT #CryptoAnalysis #SymmetricalTriangle #ChartPattern #PriceAction #Breakout #SupportResistance #Fibonacci #Altcoins #CryptoTrading
