Technical analysis by BullBearInsights about Symbol TSLAX on 8/21/2025

BullBearInsights
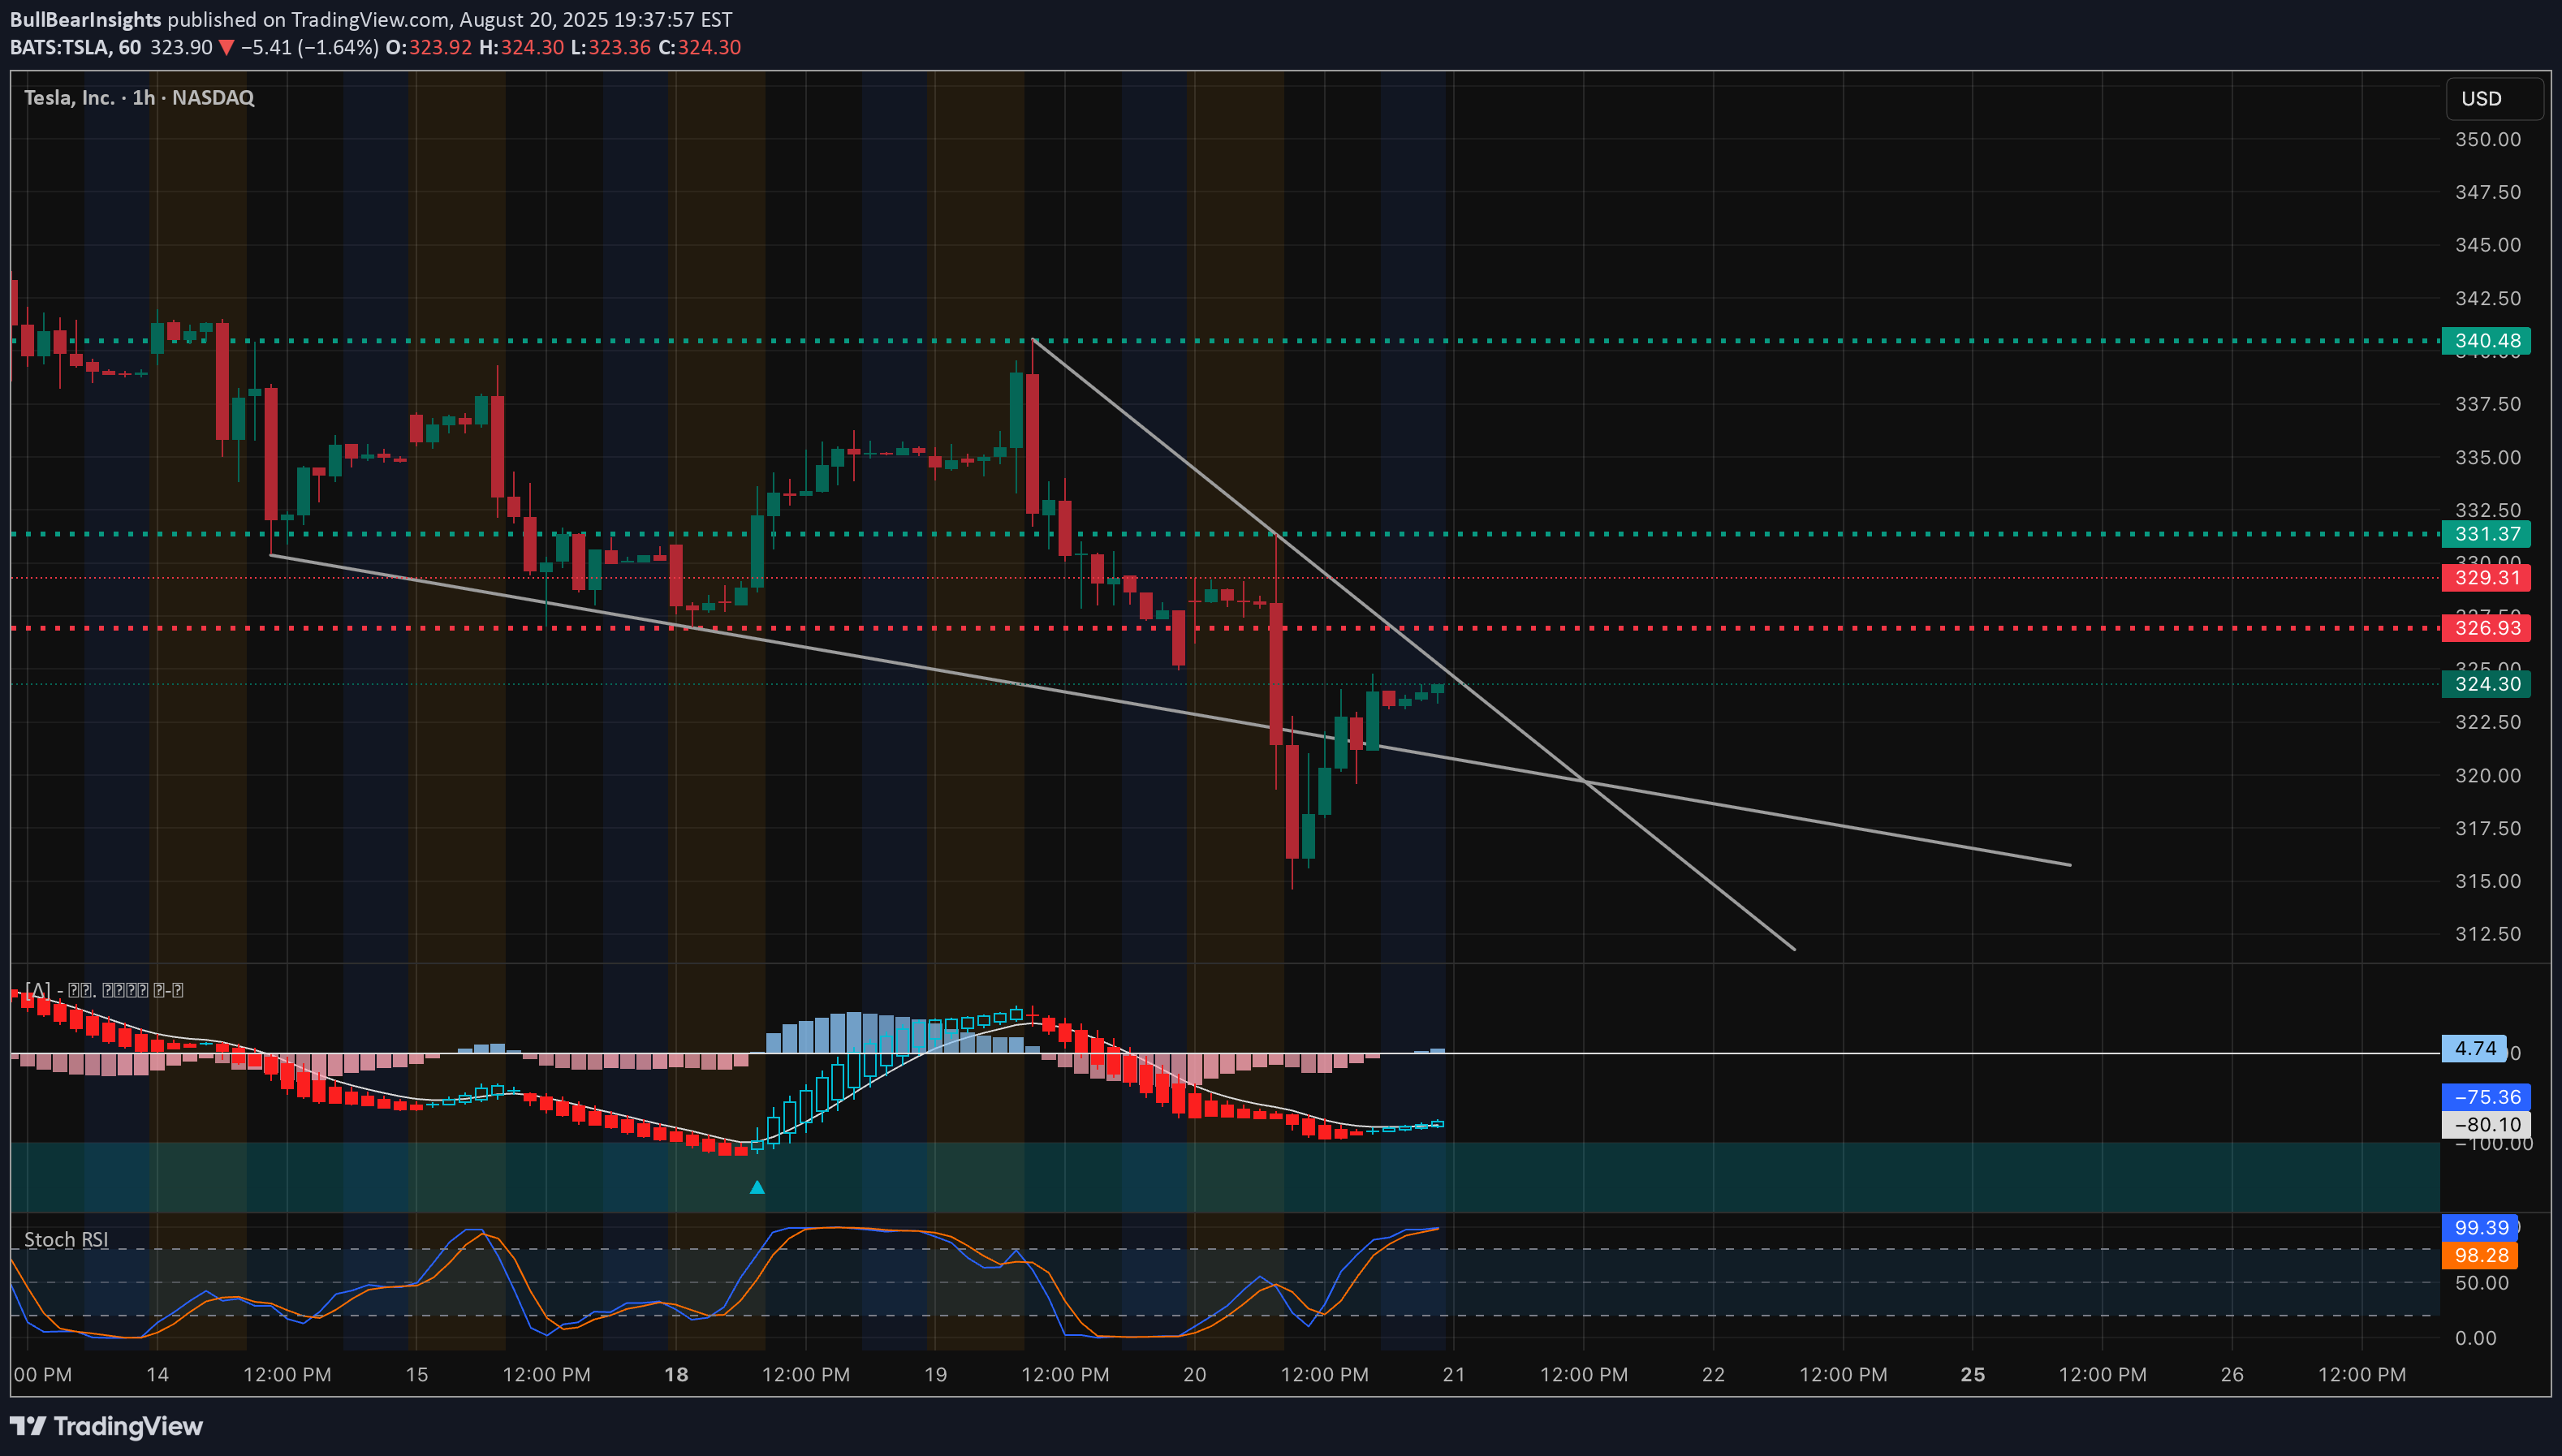
Technical Analysis (1H Chart) TSLA is currently trading near $324–325, bouncing after a sharp drop from the $340+ region. * Trendline & Structure: Price is still under a descending trendline, which acts as immediate resistance. To shift bullish, TSLA must reclaim $331–332 (prior support turned resistance). * Support Zone: Buyers stepped in around $317–320, which is now the short-term demand zone. Losing this could open downside into $312–315. * Resistance Levels: First key resistance: $331–332, followed by $340–344 if momentum extends. * Indicators: * MACD: Bearish but showing signs of flattening out, suggesting momentum slowdown. * Stoch RSI: Deeply oversold earlier, now pushing higher → potential for short-term bounce. Scenarios: * Bullish: If TSLA breaks above $331–332, momentum could push toward $340–344. * Bearish: Rejection under $331 likely leads to retests of $320–317, with risk extending to $312–315. Options Sentiment / GEX (1H) From the GEX chart: * Call Walls / Resistance: * 340–345: Heavy call resistance zone (64%+ concentration) → strong cap unless major momentum shift. * 348–350: Extreme resistance (GEX9 level). * Put Walls / Support: * 325: Highest negative NET GEX (dealer hedging zone), acting as strong support magnet. * 320 / 317.5: Stacked put walls, critical defense area. * 315: 2nd major put wall — losing this level could accelerate downside. GEX Bias: * Market makers pinned TSLA between 325 support and 340 resistance. * Upside capped unless 332 is broken; downside risk grows sharply if 317 fails. Trade Thoughts & Suggestions * Bullish Setup: Calls only make sense above 332 (target 340–344). * Bearish Setup: Favor puts if price rejects under 331 or breaks below 320 (target 317, then 315). * Neutral chop likely if TSLA stalls between 325–331. Disclaimer: This analysis is for educational purposes only and not financial advice. Trade at your own risk.
