Technical analysis by BullBearInsights about Symbol NVDAX on 8/21/2025

BullBearInsights
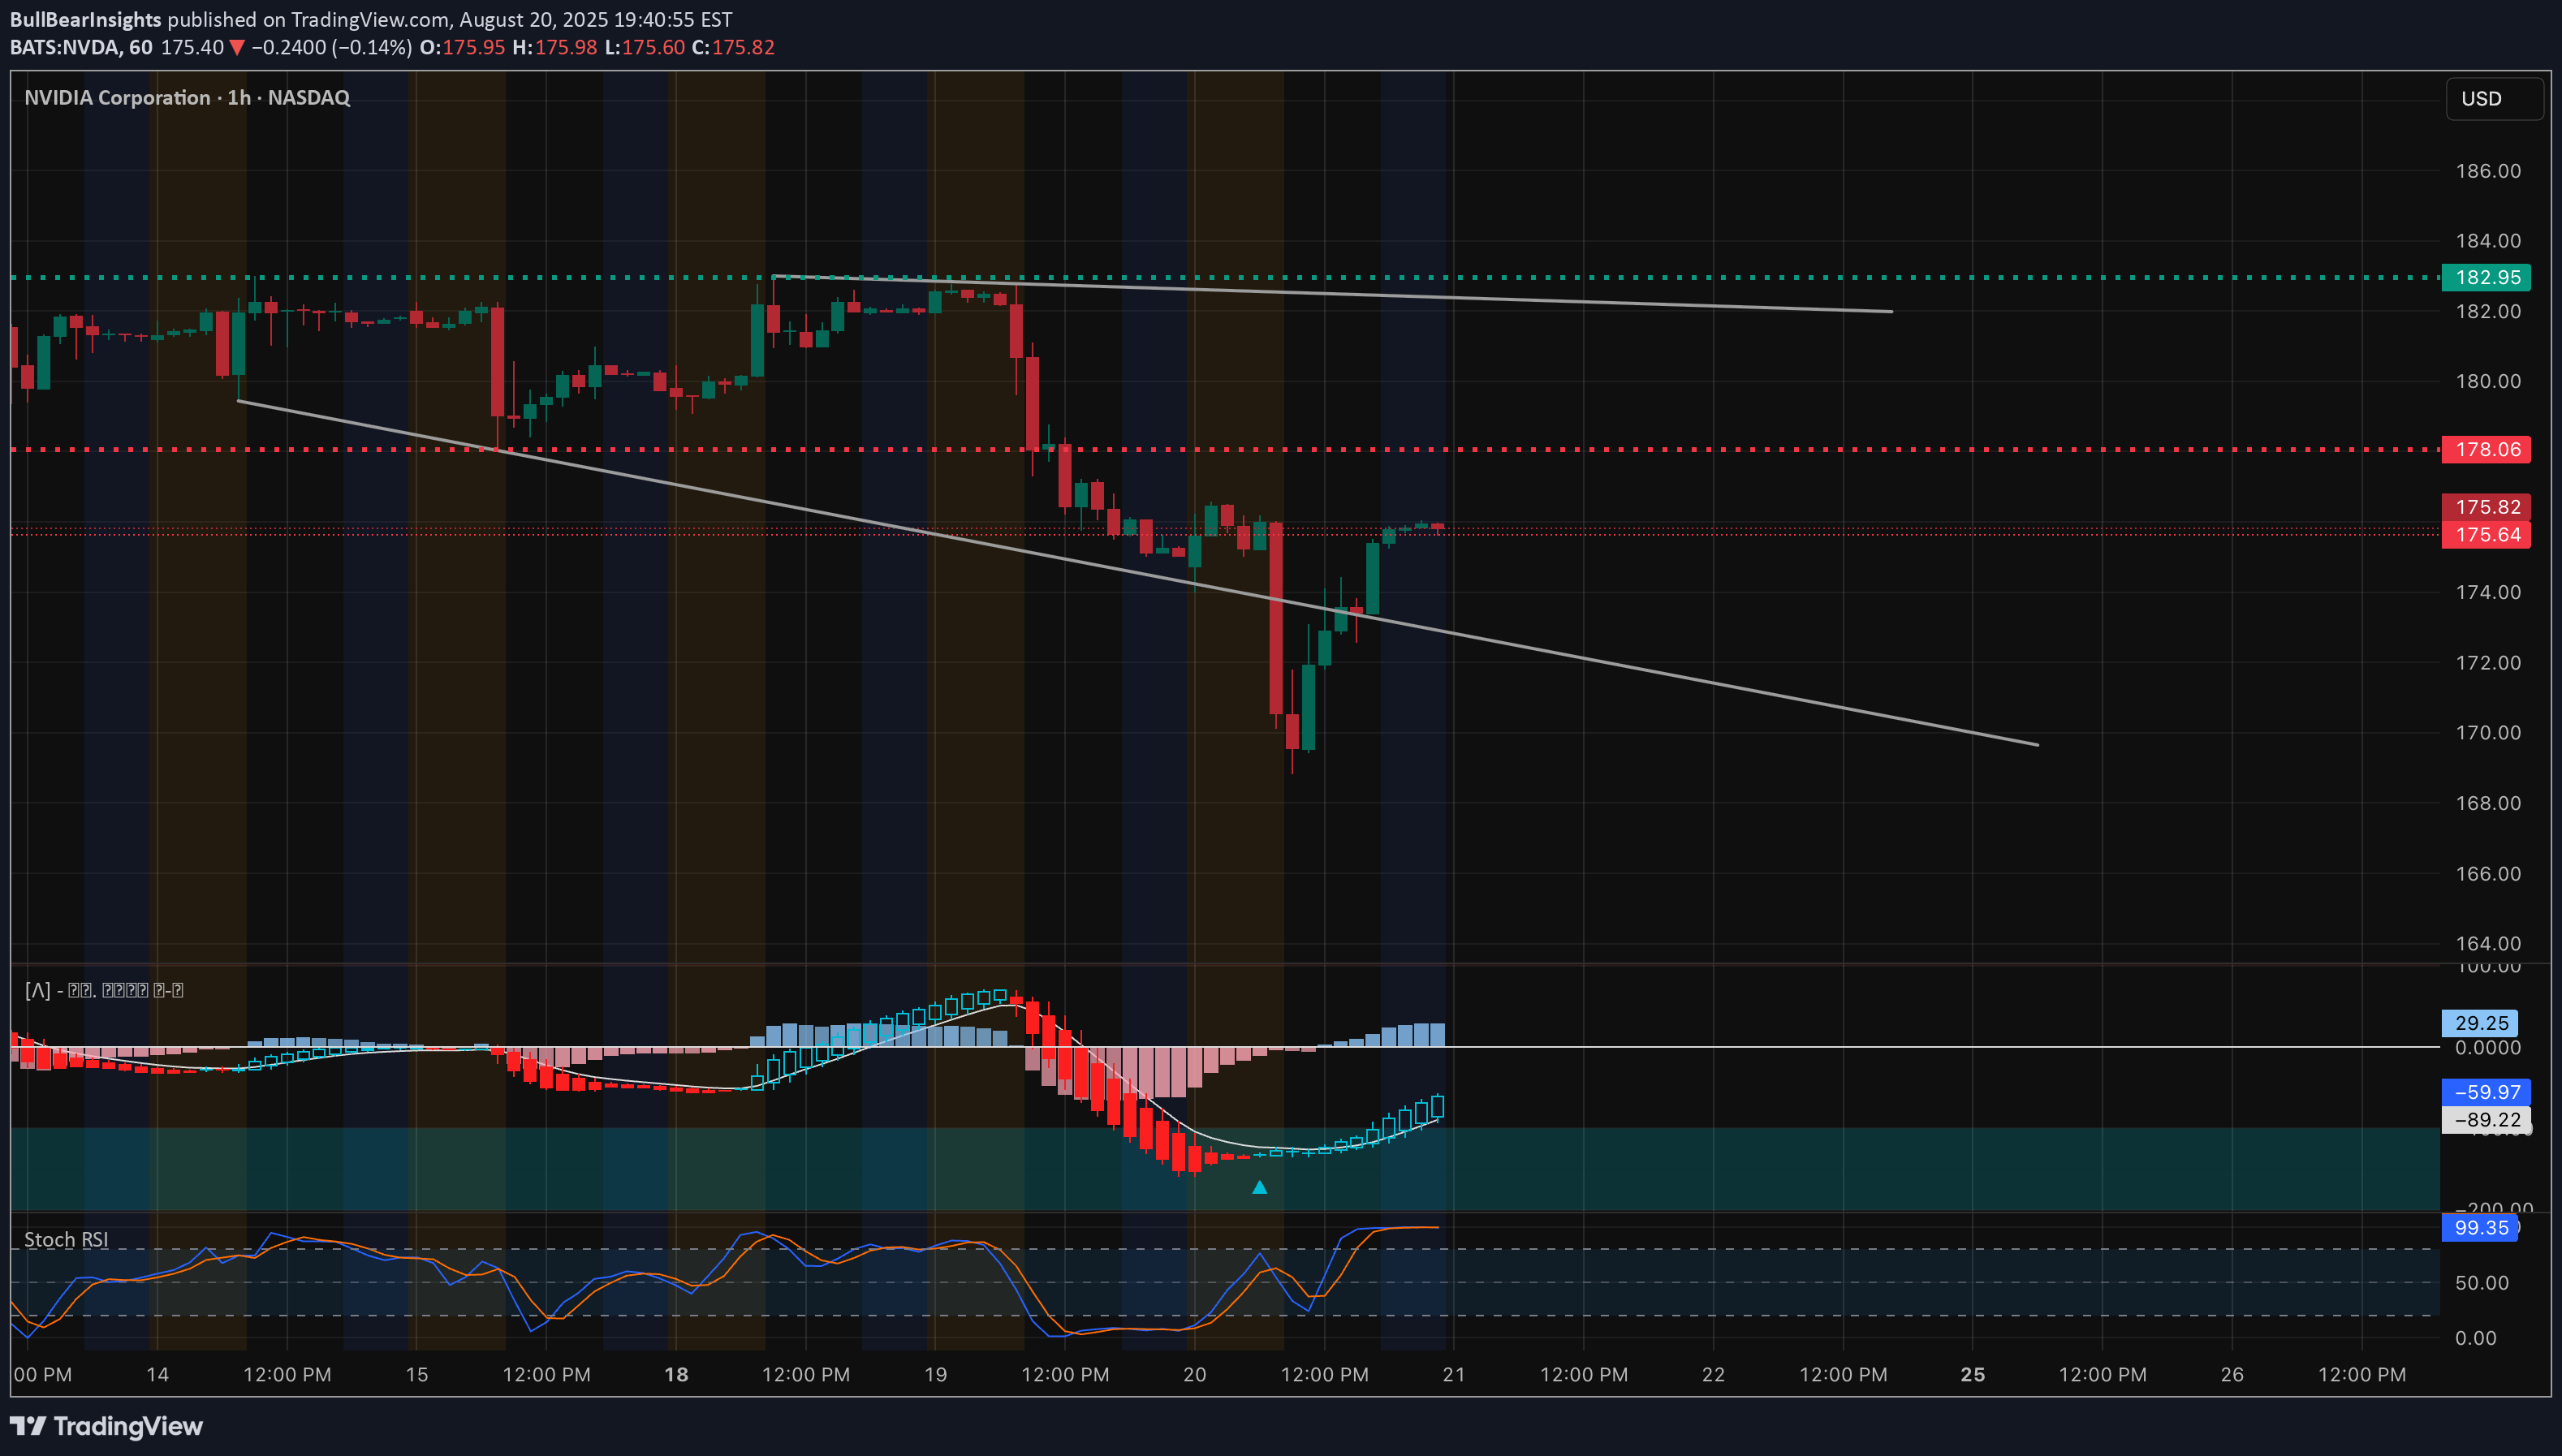
NVDA at a Pivotal Spot – Reversal or Just a Dead Cat Bounce? 🚨 Technical Analysis (1H Chart) NVDA sold off hard from the $182.5 zone, breaking structure and sliding toward $170 before bouncing. Current price is hovering near $175–176, right under a descending trendline. * Resistance Levels: * $178.0 → First key rejection point (previous supply & resistance line). * $182.5 → Strong supply zone, coincides with prior range high. * Support Levels: * $172.5 → Short-term demand from recent bounce. * $170.0 → Stronger base support; breakdown risks deeper selloff. * Indicators: * MACD is turning bullish with histogram rising, suggesting short-term momentum favoring upside. * Stoch RSI is overbought, which warns of a possible pullback after this bounce. * Trendline still points downward; NVDA must reclaim $178–182.5 to flip bullish. ⚡ Intraday Bias: Cautious bullish momentum but still within a bearish macro structure. $178–182.5 is the line in the sand. GEX / Options Sentiment The options board reinforces the technical zones: * Upside Gamma Resistance: * $178.0 → 2nd Call Wall (79%) * $182.5 → Highest positive NetGEX + Major Call Resistance * Above $182.5, upside unlocks $187.5 → $190 * Downside Gamma Support: * $172.5 → 2nd Put Wall (–81%) * $170.0 → Strongest Put Support (–87%) * Break below $170 risks fast flush toward $167.5 * Sentiment: * IVR 20.2 (low → option premiums cheap). * Options flow leaning slightly bearish with 7.9% Calls, heavy put concentration below $172. Trading Thoughts & Suggestions * Bullish Setup: Consider short-dated Calls if NVDA can hold above $175 and break $178 with volume. Target $182.5, then $187.5. Stop under $172. * Bearish Setup: If rejection comes at $178–182.5, Puts back toward $172.5 and $170 make sense. Strong stop above $183 to manage risk. Conclusion: NVDA is at an inflection zone. Short-term bounce looks promising, but unless bulls push through $178–182.5, bears keep control. Watch options walls closely — they align with key technical levels. Disclaimer: This analysis is for educational purposes only, not financial advice. Always do your own research and manage your risk.
