Technical analysis by ManiMarkets about Symbol QQQX: Sell recommendation (23 hour ago)

ManiMarkets
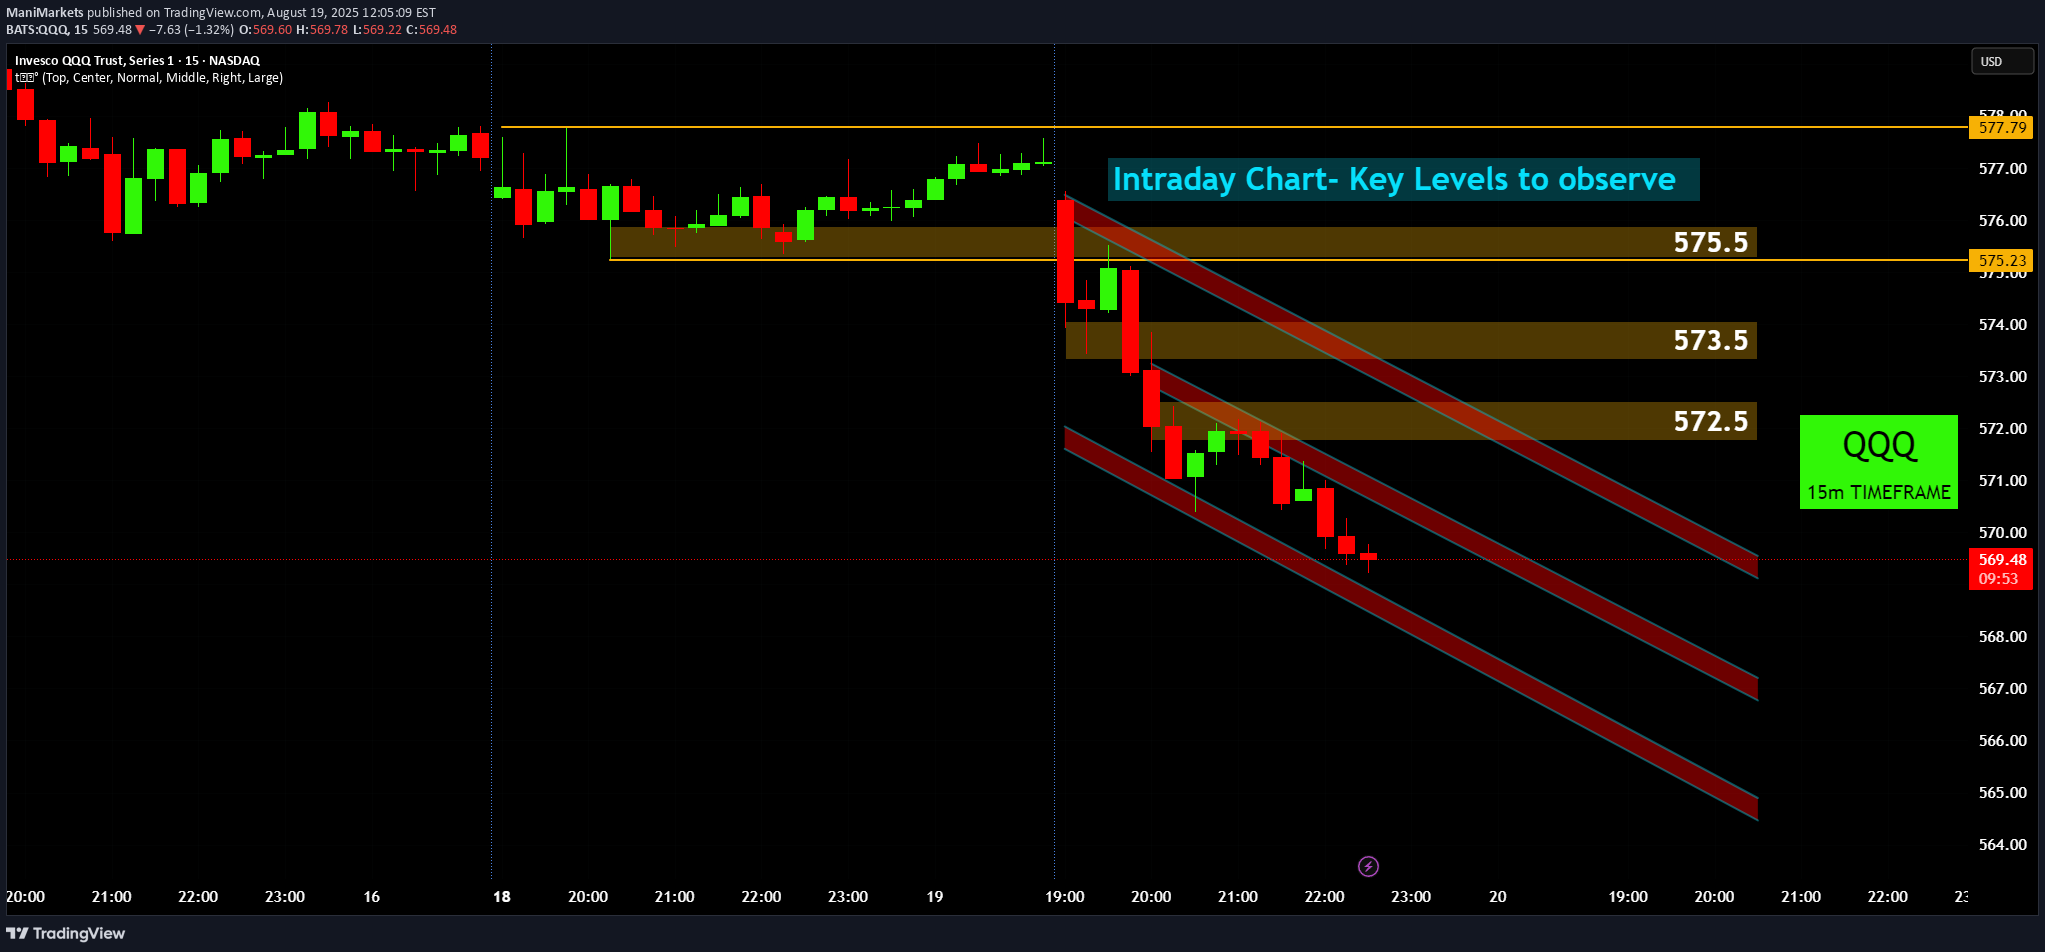
🔭 QQQ's Current View: Bearish Channel in Focus! ⬇️ QQQ's intraday chart shows a recent breakdown, with price now navigating a clear bearish channel. Initial Breakdown: QQQ experienced a sharp drop below 575.5 💥, turning previous support into immediate resistance. This marked the start of the current bearish leg. Bearish Channel Formation: Price is now moving within a well-defined descending channel 🔽🔽🔽. This indicates short-term bearish control, with sellers dominant. Overhead Resistance Zones: Key resistance levels to watch are 572.5 🧱 and 573.5 🧱. These levels, along with the channel's upper boundary, represent potential areas where sellers might step in if price attempts to rally. Intraday Outlook: Traders should monitor how QQQ reacts within this channel. A move above the channel and 573.5 would signal a shift, while continued weakness points to further downside potential within the channel. Stay vigilant on these key levels for any intraday reversal or continuation signals. Disclaimer The information provided in this chart is for educational and informational purposes only and should not be considered as investment advice. Trading and investing involve substantial risk and are not suitable for every investor. You should carefully consider your financial situation and consult with a financial advisor before making any investment decisions. The creator of this chart does not guarantee any specific outcome or profit and is not responsible for any losses incurred as a result of using this information. Past performance is not indicative of future results. Use this information at your own risk. This chart has been created for my own improvement in Trading and Investment Analysis. Please do your own analysis before any investments.
