Technical analysis by CryptoBreakers about Symbol TSLAX on 4/5/2025

TSLA is coming down to my buy zone
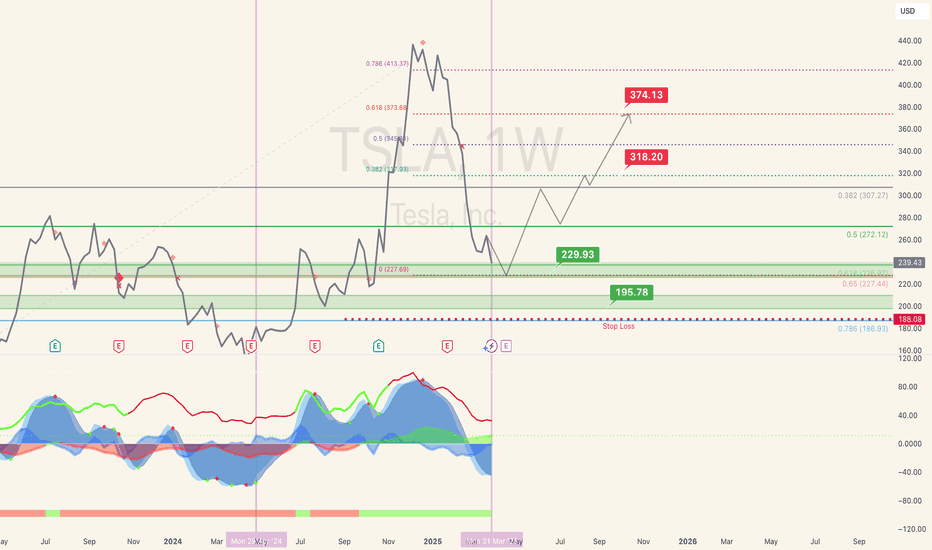
TSLA is coming down to my buy zone. I will be accumulating at 229 and below. I will start first by selling cash covered naked puts to collect credits until it drops to that zone. The goal is to get assigned with the naked put options at a cost of 229 and below to purchase TSLA shares. There is a good possibility that the next earnings of TSLA will disappoint and we might get a quick dip. In that case we may even see early 200s. I would be adding more shares there. Note that this is a weekly chart so it will take some time to play out. This is a long term hold for me. Upside Target: - Nearest upside target is 11.9% above the current price, approximately $267.86. Downside Target: - Nearest downside target is -1% below the current price, approximately $237.04. - Next downside target is approximately $195.65-196 - Support and Resistance: Monitor the support at $217.02 and resistance at $291.85 for potential breakouts or breakdowns. - Action: Given the bearish sentiment, consider waiting for a clearer bullish signal or confirmation of support holding before entering long positions. Up Volume to Down Volume Ratio 30-Days is 0.86 and 50-Days is 0.78, both below 0.8, indicating bearish sentiment in the near term so wait for it to come down to the buy zone.