Technical analysis by ManiMarkets about Symbol NVDAX: Buy recommendation (8/18/2025)

ManiMarkets
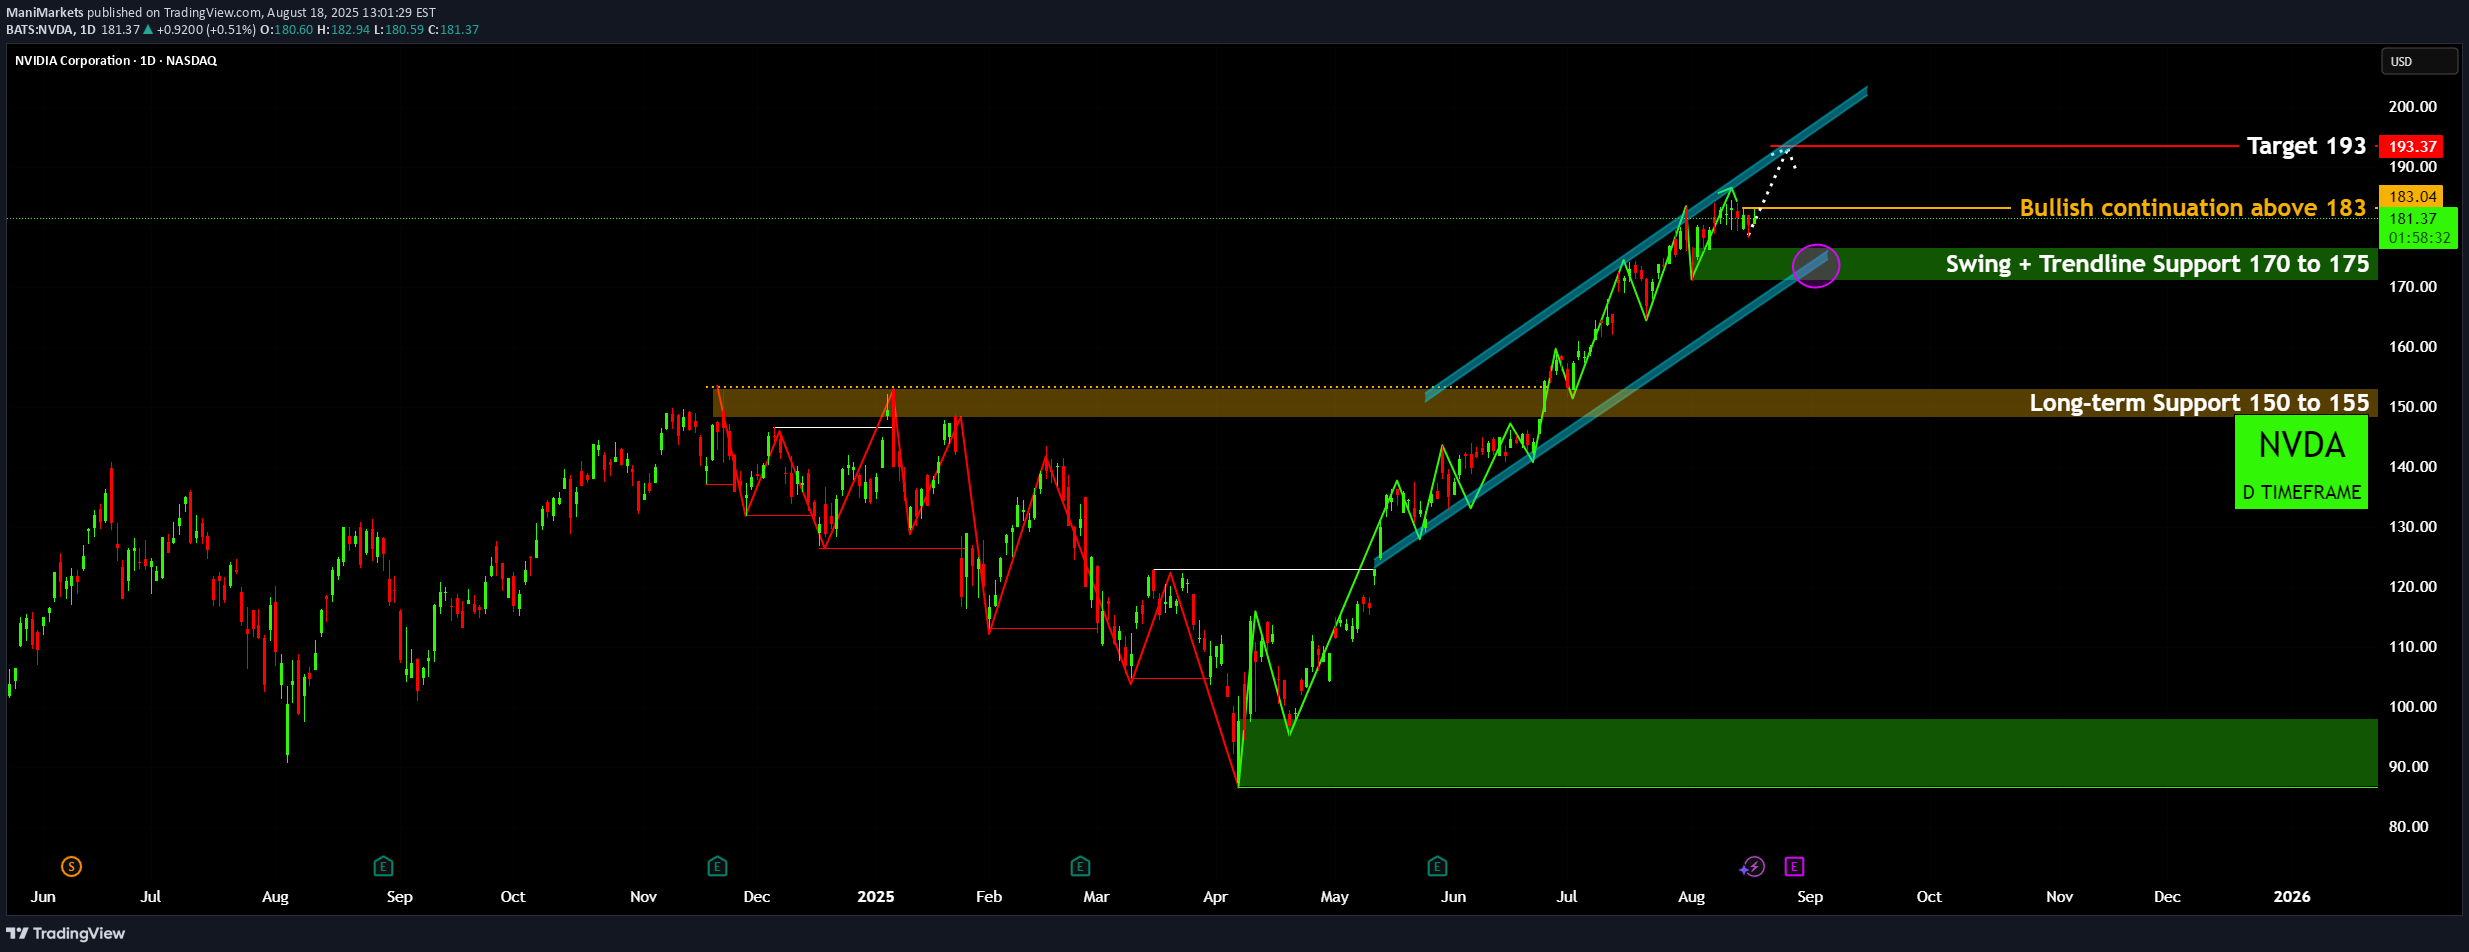
NVIDIA (NVDA): Fueling Up for Fresh Highs! 🚀 NVIDIA (NVDA) has staged a powerful recovery, turning the tide from its early 2025 lows and now poised for a significant move. A comprehensive look at the daily timeframe reveals crucial levels and a compelling bullish structure. Robust Trend Reversal & Channel Formation: Following a substantial bottom established near the 85-95 region 🎯 in April, NVDA initiated a textbook uptrend. The price action has since carved out a well-defined bullish channel 📈, consistently printing higher highs and higher lows, indicative of strong buyer conviction. Pivotal Support Foundations: The long-term 150-155 zone 🟢 now serves as a robust foundational support, having transitioned from a previous resistance level. More immediately, the 170-175 area 🟣 represents a critical confluence of a recent swing low and the lower boundary of the bullish channel. This zone is paramount for sustaining the current upward momentum. Immediate Resistance Challenge: Currently, NVDA is fiercely contending with the $183 resistance level ⚡. This is a pivotal point; a decisive breach above this mark would confirm strong bullish continuation, signaling that buyers are firmly in control and pushing for new highs. Path to Target: A confirmed break above $183 opens the gateway for a powerful push towards the $193 objective 🎯. This target aligns seamlessly with the upper boundary of the prevailing bullish channel, signaling the next potential peak for this rally. Traders should monitor the volume accompanying any breakout for confirmation. Key Levels to Monitor: While the outlook remains bullish, a failure to defend the 170-175 support would warrant caution, potentially ushering in a retest of the stronger 150-155 foundation ⚠️. Vigilance at these key levels will be crucial for navigating NVDA's next moves. Disclaimer: The information provided in this chart is for educational and informational purposes only and should not be considered as investment advice. Trading and investing involve substantial risk and are not suitable for every investor. You should carefully consider your financial situation and consult with a financial advisor before making any investment decisions. The creator of this chart does not guarantee any specific outcome or profit and is not responsible for any losses incurred as a result of using this information. Past performance is not indicative of future results. Use this information at your own risk. This chart has been created for my own improvement in Trading and Investment Analysis. Please do your own analysis before any investments.
