Technical analysis by wavepoint99 about Symbol MSTRX: Buy recommendation (5/3/2023)

wavepoint99
MSTR - Rising Trend Channel [MID TERM]
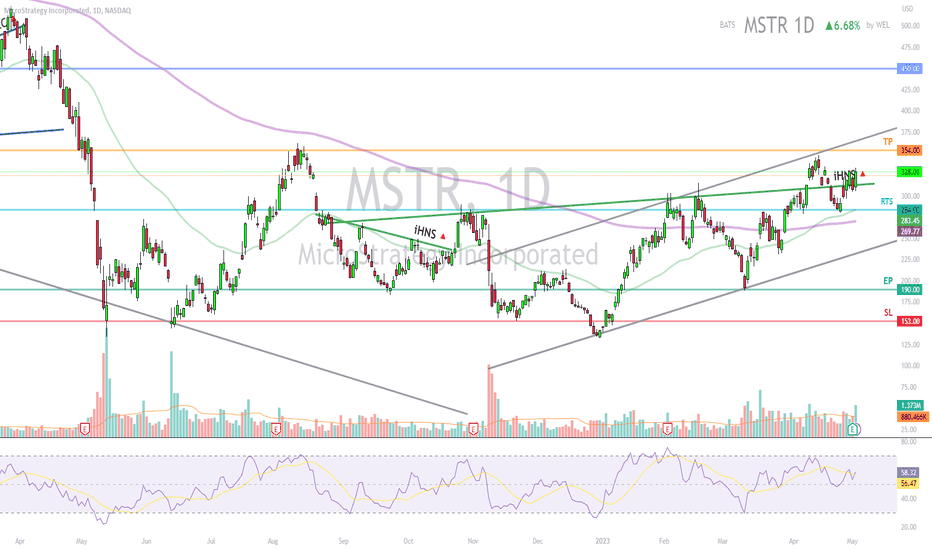
- MSTR shows strong development within a rising trend channel in the medium long term. - The stock has broken an inverse head and shoulders formation. - A decisive break of the neckline at approximately 311 will signal a further rise to 660 or more. - The stock is between support at 284 and resistance at 354. - Overall assessed as technically positive for the medium long term. *EP: Enter Price, SL: Support, TP: Take Profit, CL: Cut Loss, TF: Time Frame, RST: Resistance, RTS: Resistance to be Support LT TP: Long Term Target Price *Chart Pattern: DT - Double Top | BEARISH | RED DB - Double Bottom | BULLISH | GREEN HNS - Head & Shoulder | BEARISH | RED REC - Rectangle | BLUE iHNS - inverse head & Shoulder | BULLISH | GREEN Verify it first and believe later. WavePoint ❤️