Technical analysis by SHAHIN-M about Stock شاوان on 8/15/2025
SHAHIN-M
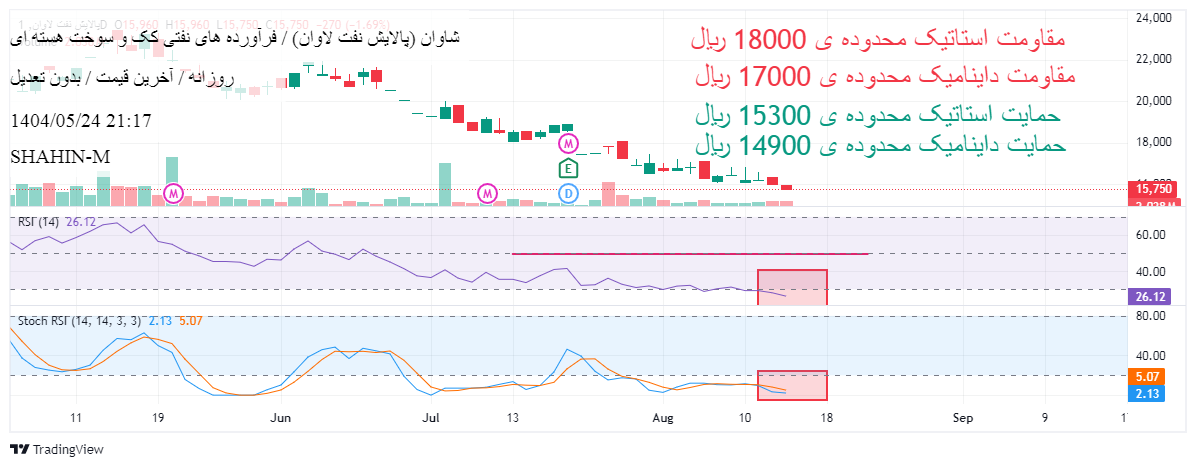
General Study of Symbols, Symbol 63 (Shawan) in the category of petroleum products Friday 24 August 1404 at 20:00 Static Support of 15300 Rials and Dynamic Support of 14900 Rials - Dynamic resistance of 17000 Rials and static resistance of 18000 Rials - The process of the two RSI and Stoke RS indicators is located in the saturation area of sales (caution in trading) - On the last day of Kendel Red and the presence of sellers has recorded more active than buyers. (Caution in transactions) - In the past 3 months, 33 days have been negative and 16 days. (Poor performance) - mainstream shareholders (average) - Technical score 2 out of 5 (weak) P/E: 4/19 - and p/e: 3/9 category (poor performance relative to your category) Periodic statistics return: - 5 -day negative 96.3 %, 10 -day negative 75.7 %, 20 days positive 78.6 %, 60 days negative 71.20 % (poor performance) -The best -selling rank of 11 of the 11 symbols in the sale of the beam (poor performance) -In terms of spring growth of 1404 compared to spring 1403, ranked 5 out of 11 (average performance)
 Rahavard