Technical analysis by CryptoNuclear about Symbol ETHFI: Buy recommendation (8/12/2025)

CryptoNuclear
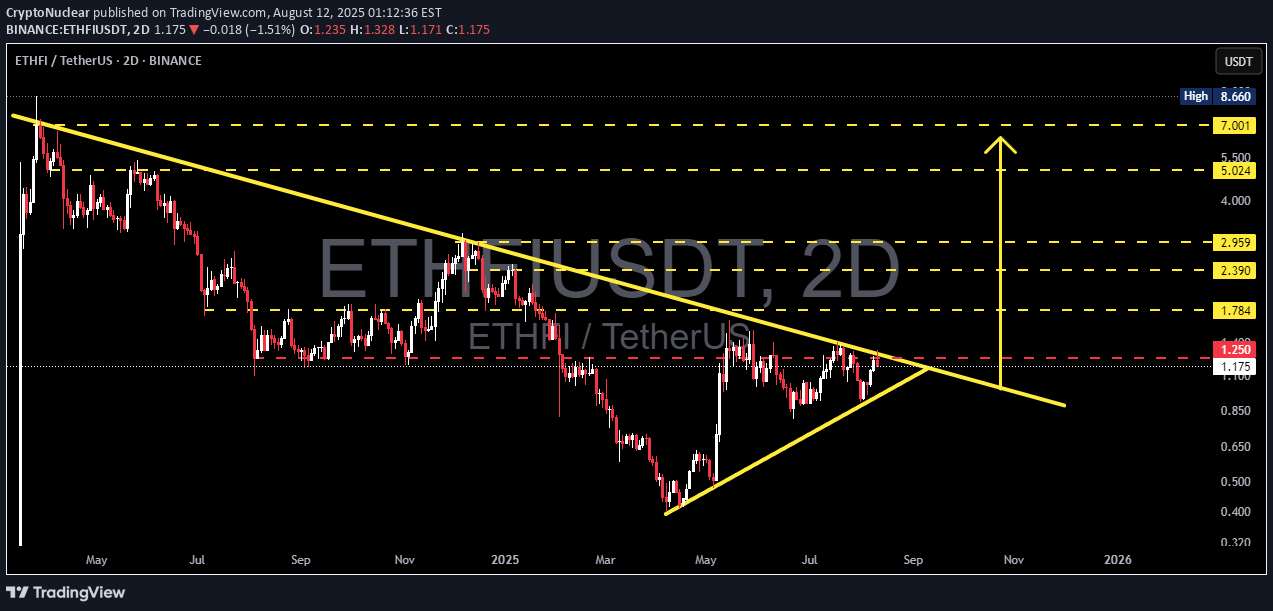
The chart shows a symmetric triangle pattern (descending resistance + ascending support) approaching its apex. Price is currently testing the descending resistance area around 1.25 (red label) — a major decision point. Key horizontal targets/support levels are already marked on the chart (yellow). --- Pattern Description * Pair: ETHFI / USDT, 2-Day timeframe. * Previous long-term trend: bearish (descending resistance line from the left). * After bottoming near \~0.32–0.40, price formed higher lows (rising support) and lower highs (falling resistance) → creating a symmetric triangle / wedge. * Volume typically contracts as the pattern nears the apex — this is a neutral-to-continuation pattern: often continues in the prior trend (bearish) but can also break upward strongly if there’s a catalyst. --- Key Levels Resistance / Upside targets: * 1.250 — near-term resistance (↑ +6.4%). * 1.784 — next major (↑ +51.8%). * 2.390 (↑ +103.4%). * 2.959 (↑ +151.8%). * 5.024 (↑ +327.6%). * 7.001 (↑ +495.8%). * 8.660 (High, ↑ +637.0%). Support / Downside levels: * 0.850 (↓ −27.7%). * 0.650 (↓ −44.7%). * 0.500 (↓ −57.4%). * 0.400 (↓ −66.0%). * 0.320 (↓ −72.8%). --- BULLISH Scenario (if breakout occurs): * Breakout confirmation: 2D candle close above the descending resistance line + above 1.250, with increased volume. Ideally, a retest as support after the breakout. * First target: 1.784 (conservative TP). If momentum is strong: 2.39 → 2.959. * Risk management: stop loss below breakout candle or below the rising support line (e.g., entry at 1.30, stop \~1.00–1.05). Use position sizing to keep per-trade risk small (1–3% of capital). * Significance: a break above will signal a potential *trend reversal* from long-term downtrend to accumulation/uptrend. BEARISH Scenario (if breakdown occurs): * Breakdown confirmation: 2D candle close below the rising support line with increased sell volume; failed retest confirms weakness. * First target: 0.850. If selling pressure continues: 0.65 → 0.50 → 0.32. * Risk management: if shorting, stop above retest/resistance (or above 1.25 if a failed breakout). * Significance: since the prior long-term trend is bearish, a breakdown has high probability of trend continuation to the downside. --- Trade Ideas * Conservative: set alerts for 2D close > 1.25 + higher volume; partial entry, partial TP at 1.78, trail the rest. * Aggressive: enter on breakout & retest of resistance as support. * Bear setup: short after confirmed close below rising support & failed retest; target 0.85 first. --- Technical & Psychological Notes: * Pattern is very close to the apex → large move likely within the next few weeks on the 2D chart. * Volume & candle close are key to avoid chasing fake breakouts. * Also watch general crypto sentiment & news catalysts as they can trigger breakouts against the technical bias. #ETHFI #Crypto #TechnicalAnalysis #Triangle #Breakout #SupportResistance #Altcoins #CryptoTrading #BullBear
