Technical analysis by CryptoNuclear about Symbol EIGEN: Buy recommendation (8/12/2025)

CryptoNuclear
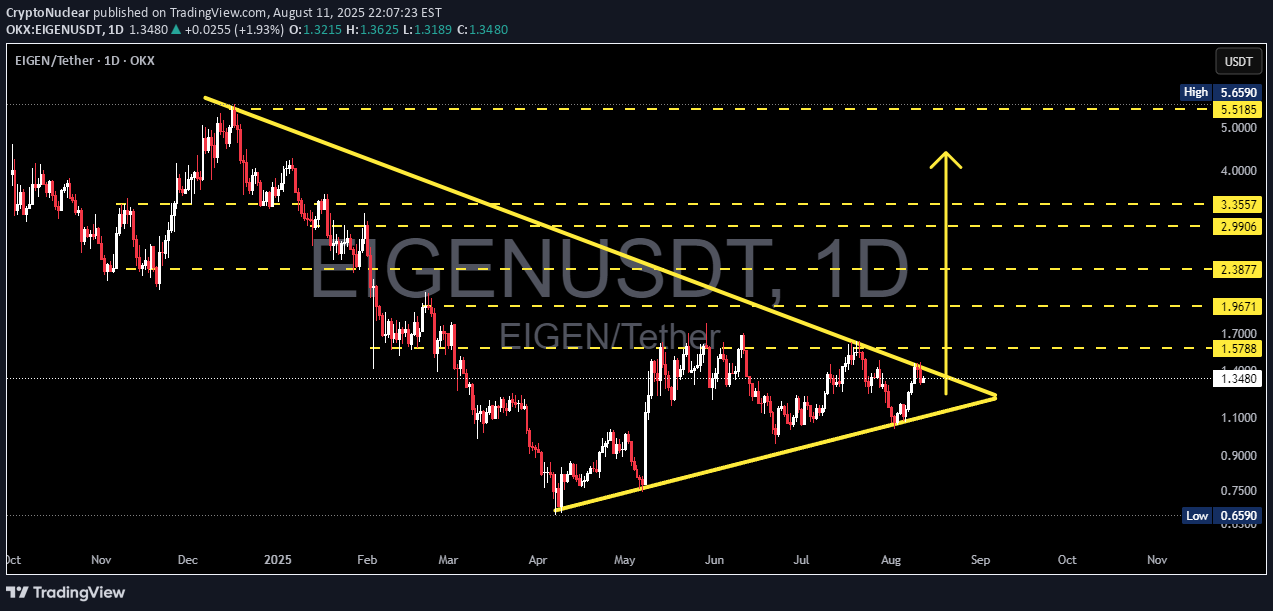
Summary The daily chart shows a symmetrical triangle pattern (descending resistance from Dec–Aug and ascending support from April). Price is currently around 1.36 USDT, squeezing into the narrow apex zone — this suggests high volatility is likely once a breakout occurs. Statistically, this pattern is neutral, but the formation of higher lows since April gives a slight bullish bias. However, given the prior strong downtrend, we must not ignore the potential for a continuation to the downside. --- Technical Pattern Details Pattern: Symmetrical triangle / contracting triangle — two converging trendlines: lower highs vs higher lows. Meaning: Consolidation between buyers & sellers, representing accumulation/distribution before a sharp move. Probability: Neutral — the breakout direction defines the medium-term bias. With the prior downtrend, continuation is possible, but persistent higher lows suggest ongoing demand. Timing: Apex likely reached in Sept; breakouts often occur before or at the apex. --- Key Levels (from chart) Current price: 1.3604 USDT Resistance levels: 1.5788, 1.9671, 2.3877, 2.9906, 3.3557, and major high at 5.52–5.66 USDT. Key support: ascending trendline & historical low at 0.6590 USDT. --- Bullish Scenario (Confirmation & Targets) Confirmation: 1. Daily candle closes above the triangle resistance (~1.58–1.65 USDT, depending on precision). 2. Breakout volume is higher than average. 3. Retest holds as support after breakout. Targets after bullish breakout: TP1: 1.5788 TP2: 1.9671 TP3: 2.3877 → 2.9906 → 3.3557 (if strong momentum) Example aggressive setup: Entry: 1.62 USDT Stop-loss: 1.30 USDT Risk per unit = 0.32 USDT TP1 (1.97) → ~1.09R TP2 (2.38) → ~2.37R --- Bearish Scenario (Confirmation & Targets) Confirmation: 1. Strong rejection at triangle resistance, followed by daily close below ascending support. 2. Increased volume on breakdown. 3. Failed retest of broken support. Targets after bearish breakdown: TP1: Local support zones (~1.10–0.90). TP2: Historical low 0.6590 USDT. Example short setup: Entry: 1.30 USDT Stop-loss: 1.60 USDT Target: 0.659 USDT → ~2.14R --- Trading & Risk Management Notes 1. Wait for confirmation — avoid early intraday breakouts. 2. Retest entries for conservative trades. 3. Stop-loss placement beyond structural levels. 4. Risk per trade: 1–3% of total capital. 5. Partial scale-in if breakout shows strong momentum. 6. Beware of fakeouts — common in tightening triangles. --- Confirmation Checklist Daily close outside trendline. Breakout volume above accumulation average. RSI/Stoch supports breakout direction. Multi-timeframe alignment (e.g., 4H, 12H). Liquidity/spread checks on exchange. --- Risk Notes Triangles after a downtrend can be continuation patterns — don’t pre-bias without confirmation. Use horizontal resistance levels for realistic profit-taking instead of overly optimistic measured moves. Watch for correlated market moves (BTC/ETH). --- EIGEN/USDT (1D) forming a symmetrical triangle — volatility spike likely as breakout nears. Wait for daily close + volume above 1.58–1.65 for bullish targets (1.97 → 2.38 → 2.99), or breakdown below ascending support for bearish targets (down to 0.659). Manage risk and watch for retests. #EIGEN #EIGENUSDT #CryptoTA #SymmetricalTriangle #BreakoutSetup #SupportResistance #TechnicalAnalysis #CryptoTrading #AltcoinAnalysis #RiskManagement
