Technical analysis by ManiMarkets about Symbol PAXG: Buy recommendation (8/4/2025)

ManiMarkets
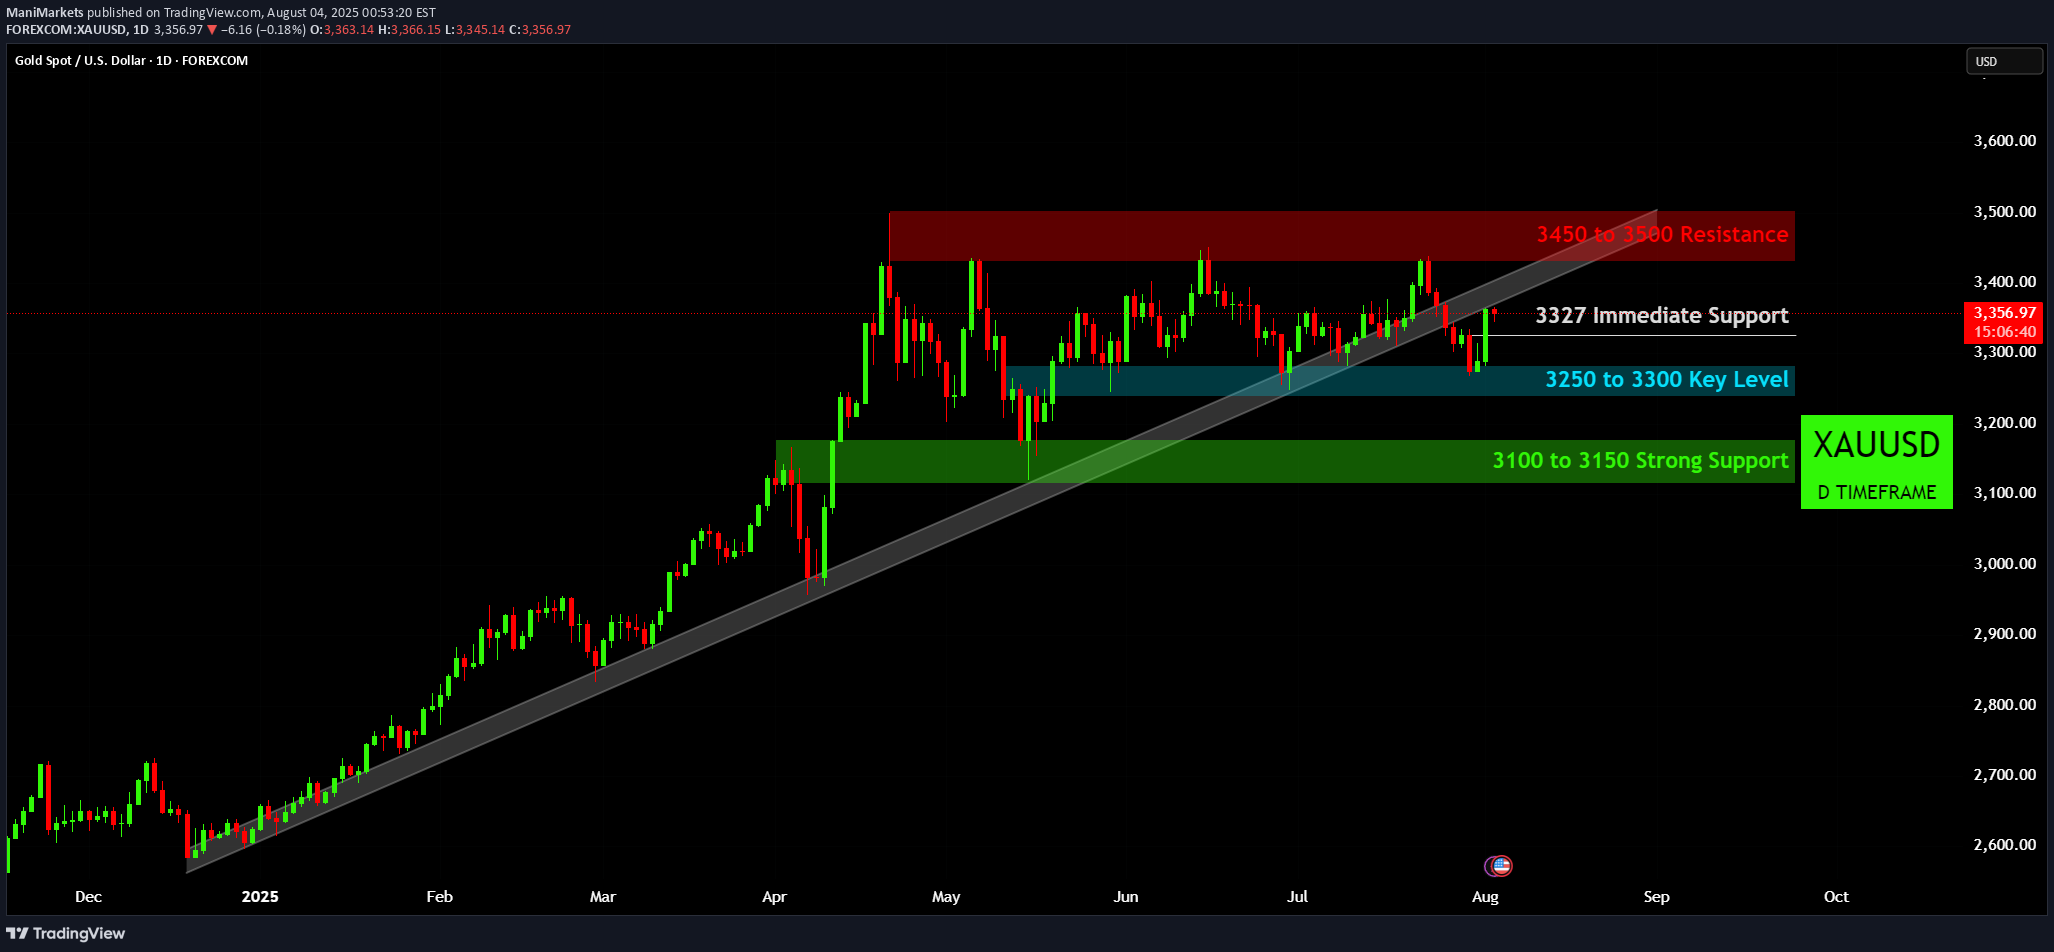
XAUUSD: A Test of the Long-Term Trendline After an impressive multi-month rally, the Gold market has entered a period of consolidation. The price action is now contained within a tightening range, and it is currently engaging with a critical confluence of support levels. This interaction will likely determine the asset's next major directional move. The Bullish Foundation & Immediate Test 📈🛡️ The long-term uptrend, which has been in place since late 2024, is still intact and is clearly defined by a strong upward sloping trendline. The market has now pulled back to test this foundational support line. This test is further reinforced by a horizontal level at 3327, creating a powerful confluence zone that the bulls must defend. A sustained hold of this region is a crucial signal for the continuation of the overall trend. The Resistance Ceiling 🛑 The upward momentum has been consistently capped by a significant supply zone, the 3450 to 3500 Resistance. This red zone has acted as a ceiling for the past several months, and a decisive breakout above this level would be a major bullish event, likely paving the way for new all-time highs. The Lower Defenses 🔵🟢 Should the immediate 3327 Immediate Support and the rising trendline fail to hold, there are two key lines of defense below. The 3250 to 3300 Key Level (blue zone) would be the next area of potential demand. Below that, the 3100 to 3150 Strong Support (green zone) represents a major demand area from a previous resistance breakout, making it the last significant defense for the bulls. Potential Scenarios for XAUUSD ⚖️ Bullish Breakout 🚀 : A strong bounce from the current support confluence would likely lead to a re-test of the 3450 to 3500 Resistance zone. A successful and sustained break above this ceiling would be a powerful signal, confirming the continuation of the long-term uptrend. Bearish Breakdown 📉 : A decisive close below the 3327 Immediate Support and the long-term trendline would indicate a shift in short-term sentiment. This could lead to a deeper correction, with the 3250 to 3300 Key Level as the first target. A failure to hold that level could see a further move down to the 3100 to 3150 Strong Support. In conclusion, Gold is at a pivotal moment, being squeezed between a long-term trendline and a major resistance ceiling. The market's reaction at the current support confluence will be the key to determining the direction of the next significant move. Disclaimer: The information provided in this chart is for educational and informational purposes only and should not be considered as investment advice. Trading and investing involve substantial risk and are not suitable for every investor. You should carefully consider your financial situation and consult with a financial advisor before making any investment decisions. The creator of this chart does not guarantee any specific outcome or profit and is not responsible for any losses incurred as a result of using this information. Past performance is not indicative of future results. Use this information at your own risk. This chart has been created for my own improvement in Trading and Investment Analysis. Please do your own analysis before any investments.
